
Planet Python
Last update: August 02, 2026 07:47 PM UTC
August 02, 2026
Mike C. Fletcher
OMI Audio extension for glTF
Another OMI-based extension, this time for positional audio mixing. Again, Claude-coded, using the OMI/KHR audio extensions for glTF as the base model and then implementing the actual mixing using Numpy. Supports mp3, wav, opus and flac inputs and stereo (headset) outputs. Up on github as omi_audio and on PyPI as omi_audio as well.
This is loosely the same model as Web Audio's Panner Node. The only significant difference from the KHR extension is that we also support VRML97 style double-ellipse emitter. The package delegates file retrieval to the application, and doesn't include any special effects or the like.
Talk Python to Me
#557: Security of everything at PyCon 2026
Security has always been the vegetables of software. Everyone agrees it matters, and somehow it never quite makes it onto the plate. At PyCon US this year, that changed. For the first time ever, security got its own dedicated, day-long track, one of just two at the whole conference, sitting right next to AI. And the room was packed to the back wall. <br/> <br/> On this episode, I'm joined by the three people at the center of it. Seth Larson, Security Developer in Residence at the Python Software Foundation and, very recently, a CPython core developer. Juanita Gomez, a PhD researcher at UC Santa Cruz in open source security, who co-chaired the track. And Mike Fiedler, PyPI's Safety and Security Engineer, one of the very few people paid full-time to keep the packages you install safe. <br/> <br/> We use the arc of the track's talks to take the temperature of Python security right now: supply chain attacks, dependency cooldowns, zero trust, SBOMs, and the push to bring Rust into CPython. And why not one of us thinks security is anywhere close to solved. Turns out that's the good news. It's why the room was full.<br/> <br/> <strong>Episode sponsors</strong><br/> <br/> <a href='https://talkpython.fm/sentry'>Sentry Error Monitoring, Code talkpython26</a><br> <a href='https://talkpython.fm/training'>Talk Python Courses</a><br/> <br/> <h2 class="links-heading mb-4">Links from the show</h2> <div><strong>Guests</strong><br/> <strong>Juanita Gomez</strong>: <a href="https://www.linkedin.com/in/juanitagomezr/?featured_on=talkpython" target="_blank" >linkedin.com</a><br/> <strong>Mike Fiedler</strong>: <a href="https://miketheman.dev?featured_on=talkpython" target="_blank" >miketheman.dev</a><br/> <strong>Seth Michael Larson</strong>: <a href="https://sethmlarson.dev?featured_on=talkpython" target="_blank" >sethmlarson.dev</a><br/> <br/> <strong>Trailblazing Python Security</strong>: <a href="https://us.pycon.org/2026/tracks/security/?featured_on=talkpython" target="_blank" >us.pycon.org</a><br/> <strong>Everything Security at PyCon US 2026 (PSF blog)</strong>: <a href="https://pyfound.blogspot.com/2026/06/everything-security-at-pycon-us-2026.html?featured_on=talkpython" target="_blank" >pyfound.blogspot.com</a><br/> <strong>Dependency Cooldowns</strong>: <a href="https://cooldowns.dev/?featured_on=talkpython" target="_blank" >cooldowns.dev</a><br/> <strong>Anatomy of a Phishing Campaign (Mike Fiedler) Recording</strong>: <a href="https://www.youtube.com/watch?v=uXW1qeUS6Yw" target="_blank" >www.youtube.com</a><br/> <strong>FedRAMP</strong>: <a href="https://www.gsa.gov/technology/government-it-initiatives/fedramp?featured_on=talkpython" target="_blank" >www.gsa.gov</a><br/> <strong>Zero Trust in 200ms: Implementing Identity-Per-Transaction with Python & Serverless-Tristan McKinnon</strong>: <a href="https://www.youtube.com/watch?v=WOOlzsJx9cg" target="_blank" >www.youtube.com</a><br/> <strong>Rust for CPython project</strong>: <a href="https://blog.python.org/2026/04/rust-for-cpython-2026-04/?featured_on=talkpython" target="_blank" >blog.python.org</a><br/> <strong>pre-PEP</strong>: <a href="https://discuss.python.org/t/pre-pep-rust-for-cpython/104906?featured_on=talkpython" target="_blank" >discuss.python.org</a><br/> <strong>Rust for CPython: Making Python Safer and More Robust for Everyone - Emma Smith</strong>: <a href="https://www.youtube.com/watch?v=42kibVnUHYE" target="_blank" >www.youtube.com</a><br/> <strong>SBOMit</strong>: <a href="https://github.com/in-toto/sbomit?featured_on=talkpython" target="_blank" >github.com</a><br/> <strong>Asleep at the Wheel: Getting your SBOMs to pay attention... - Sanchit Sahay, Abhishek Reddypalle</strong>: <a href="https://www.youtube.com/watch?v=VYY3HnRtV6U" target="_blank" >www.youtube.com</a><br/> <strong>Volatility</strong>: <a href="https://volatilityfoundation.org/?featured_on=talkpython" target="_blank" >volatilityfoundation.org</a><br/> <strong>Post Incident Runtime SBOM Generation from Python Memory - Hala Ali</strong>: <a href="https://www.youtube.com/watch?v=mgY7zuDYrag" target="_blank" >www.youtube.com</a><br/> <strong>zizmor</strong>: <a href="https://docs.zizmor.sh/?featured_on=talkpython" target="_blank" >docs.zizmor.sh</a><br/> <strong>GitHub Actions security in Python packages (Andrew Nesbitt write-up)</strong>: <a href="https://nesbitt.io/2026/05/25/github-actions-security-in-python-packages.html?featured_on=talkpython" target="_blank" >nesbitt.io</a><br/> <strong>andrew/pycon: data & analysis for the GitHub Actions security talk</strong>: <a href="https://github.com/andrew/pycon?featured_on=talkpython" target="_blank" >github.com</a><br/> <strong>GitHub Actions Security in Python Packages - Andrew Nesbitt</strong>: <a href="https://www.youtube.com/watch?v=vn3YIqdseWI" target="_blank" >www.youtube.com</a><br/> <strong>gh-profiler: examine a GitHub user's profile to gauge their contributions</strong>: <a href="https://github.com/ehmatthes/gh-profiler?featured_on=talkpython" target="_blank" >github.com</a><br/> <strong>PyCon US YouTube channel</strong>: <a href="https://www.youtube.com/@PyConUS" target="_blank" >www.youtube.com</a><br/> <strong>SBOMit: adding verification to SBOMs (OpenSSF)</strong>: <a href="https://openssf.org/blog/2023/12/13/introducing-sbomit-adding-verification-to-sboms/?featured_on=talkpython" target="_blank" >openssf.org</a><br/> <strong>Ecosystems</strong>: <a href="https://ecosyste.ms?featured_on=talkpython" target="_blank" >ecosyste.ms</a><br/> <br/> <strong>Watch this episode on YouTube</strong>: <a href="https://www.youtube.com/watch?v=ktEssFryRjY" target="_blank" >youtube.com</a><br/> <strong>Episode #557 deep-dive</strong>: <a href="https://talkpython.fm/episodes/show/557/security-of-everything-at-pycon-2026#takeaways-anchor" target="_blank" >talkpython.fm/557</a><br/> <strong>Episode transcripts</strong>: <a href="https://talkpython.fm/episodes/transcript/557/security-of-everything-at-pycon-2026" target="_blank" >talkpython.fm</a><br/> <br/> <strong>Theme Song: Developer Rap</strong><br/> <strong>🥁 Served in a Flask 🎸</strong>: <a href="https://talkpython.fm/flasksong" target="_blank" >talkpython.fm/flasksong</a><br/> <br/> <strong>---== Don't be a stranger ==---</strong><br/> <strong>YouTube</strong>: <a href="https://talkpython.fm/youtube" target="_blank" ><i class="fa-brands fa-youtube"></i> youtube.com/@talkpython</a><br/> <br/> <strong>Bluesky</strong>: <a href="https://bsky.app/profile/talkpython.fm" target="_blank" >@talkpython.fm</a><br/> <strong>Mastodon</strong>: <a href="https://fosstodon.org/web/@talkpython" target="_blank" ><i class="fa-brands fa-mastodon"></i> @talkpython@fosstodon.org</a><br/> <strong>X.com</strong>: <a href="https://x.com/talkpython" target="_blank" ><i class="fa-brands fa-twitter"></i> @talkpython</a><br/> <br/> <strong>Michael on Bluesky</strong>: <a href="https://bsky.app/profile/mkennedy.codes?featured_on=talkpython" target="_blank" >@mkennedy.codes</a><br/> <strong>Michael on Mastodon</strong>: <a href="https://fosstodon.org/web/@mkennedy" target="_blank" ><i class="fa-brands fa-mastodon"></i> @mkennedy@fosstodon.org</a><br/> <strong>Michael on X.com</strong>: <a href="https://x.com/mkennedy?featured_on=talkpython" target="_blank" ><i class="fa-brands fa-twitter"></i> @mkennedy</a><br/></div>
August 01, 2026
Seth Michael Larson
Let’s Play “htmx 4: the game”
Moments ago I just finished playing “htmx 4: the game”, the first JavaScript library published exclusively for Game Boy and Game Boy Color. I've recorded my play session and published the video to YouTube:
When I first saw this announcement it was pure blog bait for me. Game Boy, open source software, reverse-engineering, oh my. I purchased the cartridge within moments of seeing the announcement.
The Game Boy cartridge arrived earlier today inside a custom cardboard box and plastic case which I appreciate! The box was tight to open without ripping the cardboard, I managed with the help of some tweezers. The game is on a Game Boy cartridge with a label. The cartridge itself reads “Game” instead of “Game Boy” to avoid running afoul of Nintendo trademarks and licensing.

I was unable to dump the ROM using my Epilogue GB Operator, the cartridge didn't fit into the slot unless I angled it weirdly and even then the cartridge wouldn't give the GB Operator the consistent connection it needs to dump the ROM. This was unfortunate, I wanted to dig into the ROM itself more for this post, but that will have to be another day. I suspect the tolerances for the cartridge are just outside what the Epilogue will tolerate. I switched over to my Game Boy Player to capture footage of game play with my HDMI-modded GameCube. Here the cartridge fit and worked just fine.
The game is tough (especially The Slop Factory, yeesh) and took me over an hour to complete, and I didn't even find all 4 HTMX letters in each stage... hinting that there is more to be discovered! There was pervasive lag while playing which the game’s story blames on... React. A likely story! ;)
Going in I wasn't sure how they were going to distribute the final source code... Would there be a QR code to the source code (which would have been a disappointment) or would the htmx team actually make you type it in yourself like a BASIC program from a magazine? I was so happy to see that the htmx team went all the way, it means I'm even more excited to dig into this ROM!
As a software distribution mechanism... including
ordering the game, waiting for delivery, beating
the game, and then typing in the source code by
hand from the Game Boy screen... Let's say it's
slightly less user-friendly than npm install :)
But that's the fun of a project like this.
Thanks for reading ♥ I would love to hear your thoughts! Contact me via Mastodon, Bluesky, or email. Browse the blog archive. Check out my blogroll.
July 31, 2026
Programiz
Python Booleans and Boolean Expressions
Caktus Consulting Group
Chicago Like a Local: Things to Do During DjangoCon US 2026 (Part 1)
DjangoCon US 2026 is coming back to Chicago from August 23–28, and we at Caktus couldn’t be more thrilled, not only to be returning as a Silver Sponsor, but also because I (Keanya) have the privilege of chairing the conference once again!
Jaime Buelta
Python Automation Cookbook 3rd edition: now with AI recipes.
Exciting news! The third edition of the Python Automation Cookbook is out, featuring a vibrant new cover and over 100 pages of fresh AI content. Aimed at Python enthusiasts of all levels, it retains classic recipes while introducing innovative ways to incorporate AI in code. A fantastic addition to any developer's library!
Python Software Foundation
Get Ready: Python Packaging Council Nominations Opening Soon!
The inaugural Python Packaging Council Election nomination period opens next week on Tuesday, July 28th, 2:00 pm UTC and closes on Tuesday, August 11th, 2:00 pm UTC.
The Python Packaging Council (PPC) will be the technical decision-making body for the interoperability specifications that govern how Python packages are built, distributed, and installed. It will also coordinate efforts among packaging tool maintainers, the Python core team, and the broader community.
Running for the Packaging Council
Do you have a vision for improving the Python packaging experience? Do you make the tools used to build and consume Python packages? Are you passionate about building communities, consensus, and standards focused on the user experience? If these resonate with you, and you have the time to attend regular meetings and participate in the standardization process, you should consider running for the inaugural PPC!
We're looking for candidates who can build bridges between projects and communities, who enjoy working with a very large community of passionate volunteers, and have a willingness to represent the wider community ahead of any single tool, project, or employer. We also welcome candidates who have a diverse set of skills and experiences, including open-governance experience, community stewardship, fundraising knowledge, and (of course!) technical expertise in Python packaging and distribution.
PEP 772 does provide non-binding operational suggestions, which hint at how the council could function. As this is the inaugural PPC, the individuals serving on it will be establishing the initial operating procedures, scope, interests, and agenda that future councils will build upon. Notably, "establishing specific processes for [the] Packaging Council and PyPA relationship" is something that the inaugural Packaging Council is expected to do.
Election Overview
The 2026 inaugural election fills all five seats on the PPC. The two candidates receiving the highest number of votes shall be designated Cohort A with a two year term, and the three candidates receiving the next highest number of votes shall be designated Cohort B with a one year term.
In future elections, each cohort will be elected for a full two-year term in alternating years, so that roughly half of the PPC turns over each cycle.
Election Timeline
- Nominations open: Tuesday, July 28th, 2:00 pm UTC
- Nomination cut-off: Tuesday, August 11th, 2:00 pm UTC
- Announce candidates: Thursday, August 13th
- Voter affirmation cut-off: Tuesday, August 25th, 2:00 pm UTC
- Voting start date: Tuesday, September 1st, 2:00 pm UTC
- Voting end date: Tuesday, September 15th, 2:00 pm UTC
Not sure what UTC is for you locally? Check this UTC time converter!
Nomination details
You can nominate yourself or someone else. If you're nominating someone else, we'd encourage you to reach out to them first to make sure they're excited about the opportunity and give them a heads up that they'll need to submit their own nomination statement too. Remember, nominees must themselves be PSF voting members, and nomination statements must include information about the nominee’s relevant affiliations.
To submit a nomination for yourself or someone else, use the 2026 PPC Election Nomination Form on our website. The form will open on Tuesday, July 28th, 2:00 pm UTC and close on Tuesday, August 11th, 2:00 pm UTC.
Voting Reminder!
Every PSF Voting Member (Supporting, Contributing, and Fellow) needs to be a member in good standing by August 25th and affirm their membership to vote in this election. You should have received an email with information on how to affirm your voting status.
You can see your membership record and status on your PSF Member User Information page. If you are a voting-eligible member and do not already have a login, please create an account on psfmember.org first and then email pc-elections@python.org so we can link your membership to your account.
Seth Michael Larson
Extracting “Ocarina of Time: Master Quest” ROM from the Legend of Zelda: Wind Waker bonus disc
Another day, another extracting ROMs from GameCube titles mini-tutorial. This time it’s the PAL Legend of Zelda: Wind Waker Bonus Disc that I recently purchased from Kraków, Poland. This disc contains two N64 games: Legend of Zelda: Ocarina of Time and the “Master Quest” version of Ocarina of Time. Let’s extract those ROMs from the GameCube ROM so we can play on other emulators.
Going from a GameCube disc to an ISO ROM is the usual
process, for me that means using the FlippyDrive Disc Backup
Utility but CleanRip on a GameCube or Wii also works.
To extract the individual files from the ISO open
the ISO in Dolphin, right-click the ISO, Properties,
Filesystem, and extract the zlj_f.tgc file into
your working directory.
According to The Cutting Room Floor both N64 ROMs
are included in the file zlj_f.tgc. TGC is an
archive format that Nintendo uses often in this generation
of games. Thanks to resources like No Intro
we have the known-good ROM lengths and hashes for both Ocarina of
Time and Master Quest for all regions. Using this information
(along with the N64 ROM header) we can find the embedded N64 ROMs
within zlj_f.tgc without understanding the TGC format at all:
# License: MIT

import hashlib

ROM_HEADER = b"\x80\x37\x12\x40"
ROM_LENGTH = 0x2000000
ROM_HASHES = {
    "1618403427e4344a57833043db5ce3c3": "Legend of Zelda, The - Ocarina of Time - Master Quest (Europe) (En,Fr,De) (Zelda Collection).n64",
    "2c27b4e000e85fd78dbca551f1b1c965": "Extracted Legend of Zelda, The - Ocarina of Time (Europe) (GameCube).n64",
    # If you see 'Unknown ROM', paste the MD5 into
    # https://datomatic.no-intro.org/index.php
    # searching on 'hash-data' and add the values here.
}

def main():
    data = open("zlj_f.tgc", "rb").read()

    # Find the embedded ROMs from the N64 ROM header.
    offset1 = data.find(ROM_HEADER)
    offset2 = (offset1 + 4) + data[(offset1 + 4):].find(ROM_HEADER)
    for offset in (offset1, offset2):

        # Determine which ROM we have based on MD5.
        rom = data[offset:offset + ROM_LENGTH]
        rom_md5 = hashlib.md5(rom).hexdigest()
        to_file = ROM_HASHES.get(rom_md5, None)
        if to_file is None:
            print(f"Unknown ROM ({rom_md5})")
            continue

        with open(to_file, "wb") as f:
            f.truncate()
            f.write(rom)
        print(f"Extracted {to_file} ({rom_md5})...")


if __name__ == "__main__":
    main()
The script above only knows about the ROM hashes for
the PAL revision of the Bonus Disc, so if you see Unknown ROM (...),
don't panic! You can search the MD5 you receive on No Intro
by filtering on hash-data to discover whether the ROM
is correct and add the value to ROM_HASHES in the script.
With my Master Quest ROM in hand I can load the game into Delta Emulator and play on my iPhone:
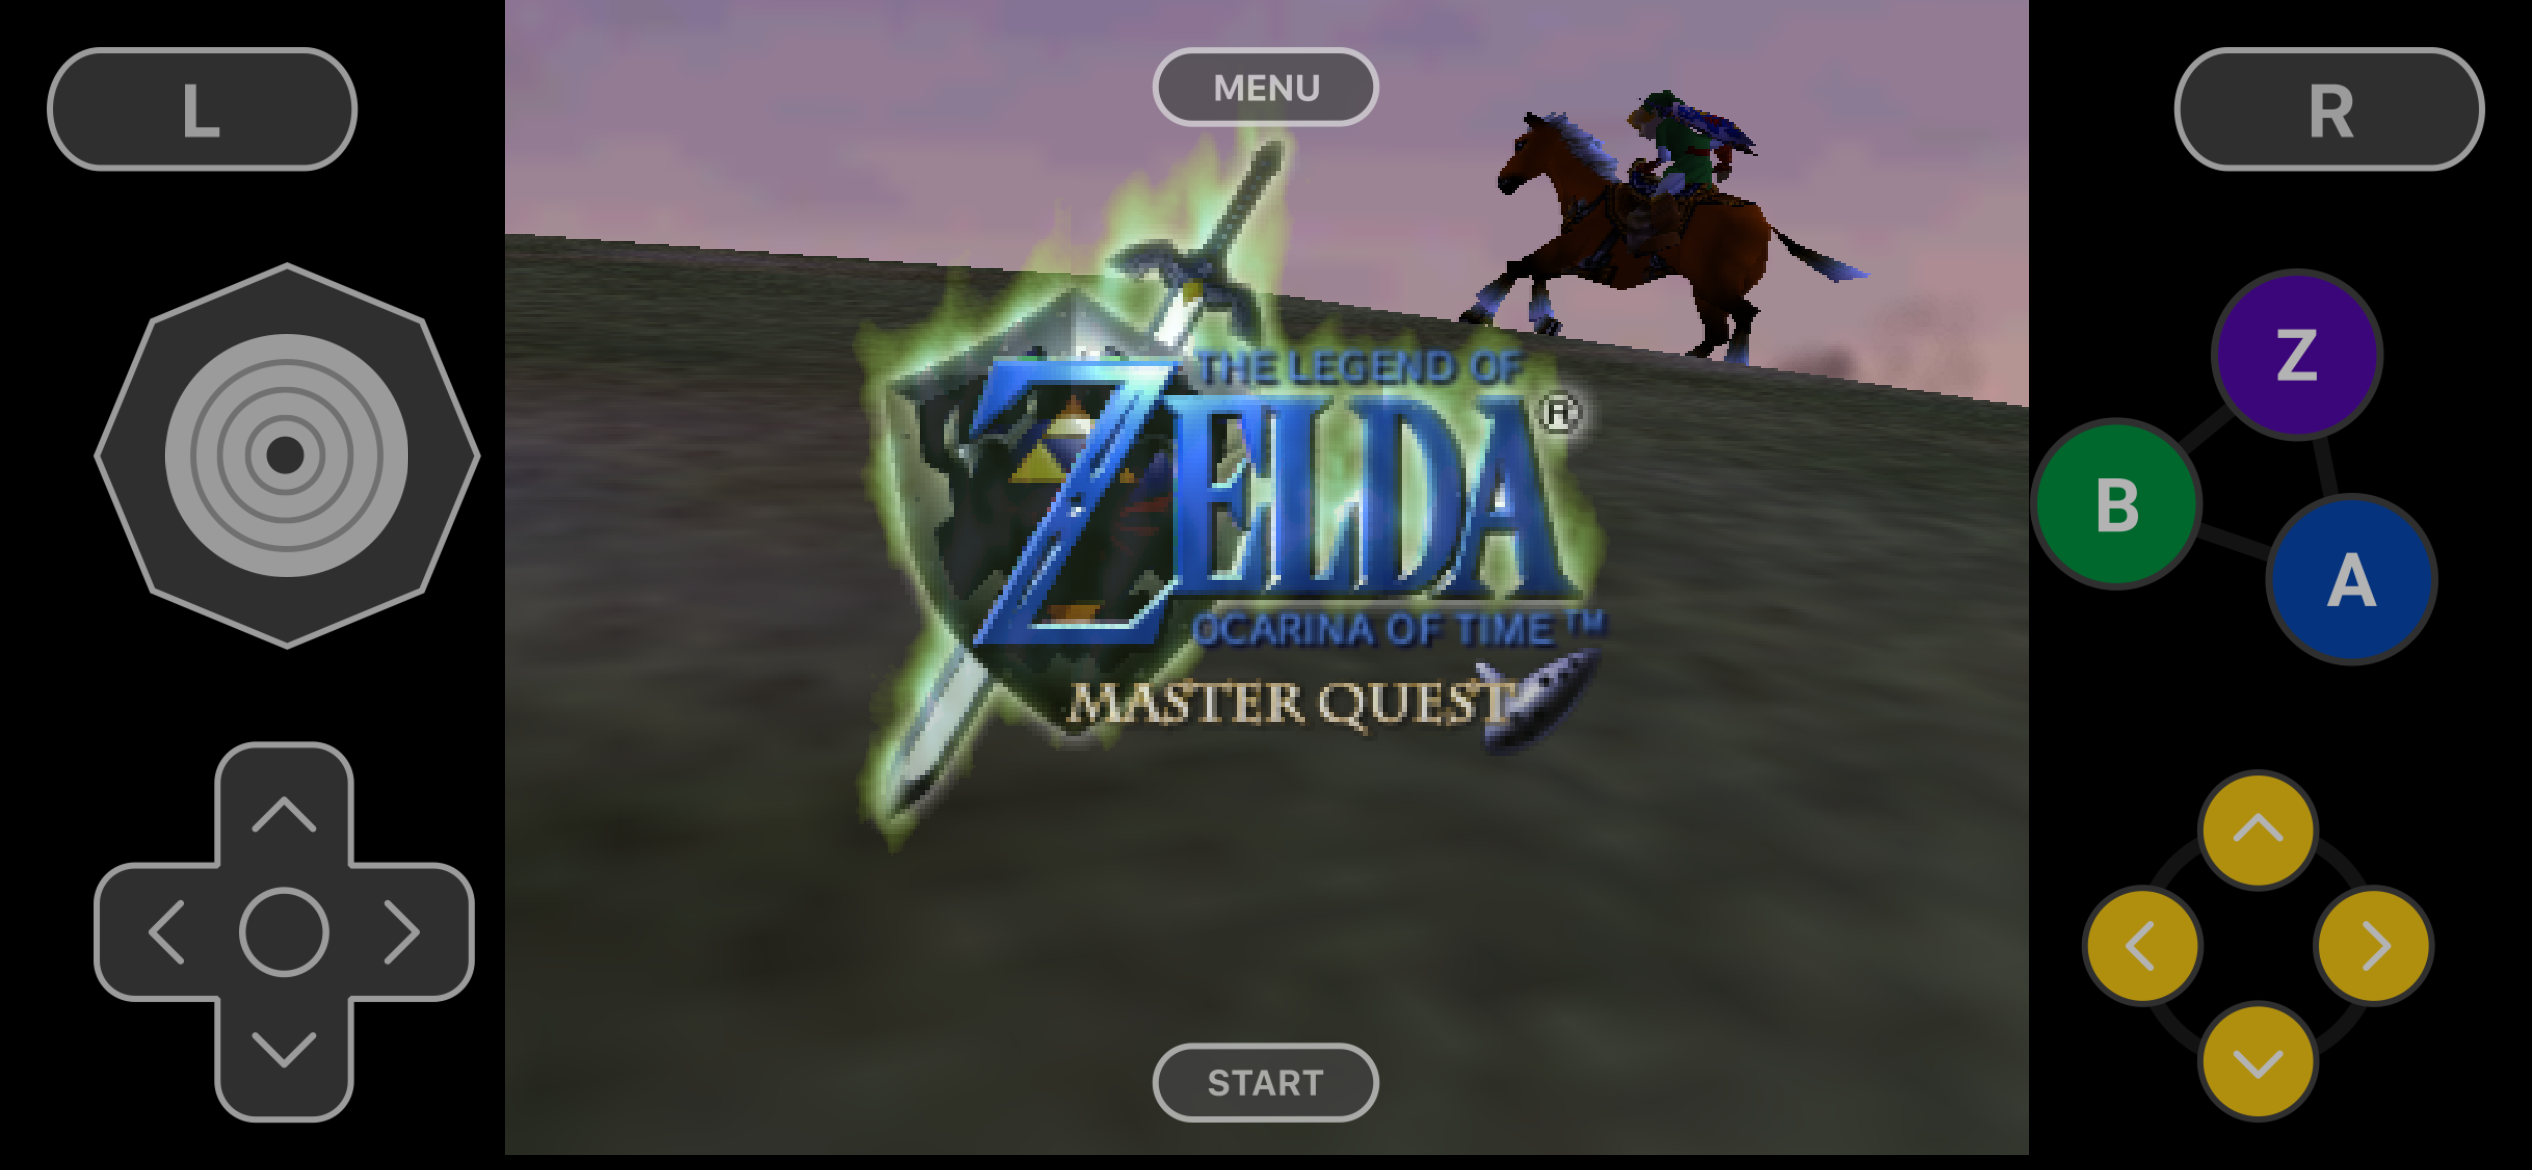
Legend of Zelda: Ocarina of Time Master Quest running in the Delta Emulator
I won’t be playing much because I have never played Ocarina of Time before and want to play the upcoming remake for the Nintendo Switch 2 with a completely blank slate. I’m excited to try one of the most universally acclaimed games ever made for the first time soon! :)
What’s new in the blogroll?
I publish a blogroll containing links to websites that I've enjoyed recently.
Pokémon cards were on the mind the past few weeks! My brother is a collector so we've been discussing the different artists and sets that he's interested in. While I was doing research I came across two websites that seemed useful for this: collating Pokémon set symbols and Pokémon card artwork by artist. A comedic graphic design YouTuber “Elliot” also published a new video about Pokémon’s graphic designs which I found entertaining.
I purchased “htmx 4: the game”, the first JavaScript library published exclusively to the Nintendo Game Boy platform. The package (hah) arrives today and I plan to post about the experience with the game and discussing the form factor as a software distribution mechanism, look forward to that blog post soon.
I found a Game Boy Link Cable to internet adapter hardware project which looks intriguing if you've got friends that are far away that you still want to play Generation 3 Pokémon with (Pokémon Emerald forever). This hardware enables trading, battling, record mixing, and more by pretending to be your peer in a GBA Link Cable connection.
Thanks for reading ♥ I would love to hear your thoughts! Contact me via Mastodon, Bluesky, or email. Browse the blog archive. Check out my blogroll.
July 29, 2026
Django Weblog
DSF member of the month - Katherine "Kati" Michel
For July 2026, we welcome Katherine "Kati" Michel as our DSF member of the month! ⭐

Kati is involved in the Django community for many years. She was a DEFNA Director for 8 years and DjangoCon US Website Chair and Co-Chair. She is a DSF member since December 2017!
You can learn more about Kati by visiting Kati's website and her GitHub Profile.
Let’s spend some time getting to know Kati better!
Can you tell us a little about yourself? (hobbies, education, etc)
In 2002, I was living in Lawrence, Kansas and working for government contracts supporting US Citizenship and Immigration Services and the US Department of Education. While working for USCIS, I spoke to tens of thousands of people from around the world, but hadn't seen much of the world myself. In 2009, I decided to move to England and earn a master's degree from Lancaster University Management School. During the program, I was fortunate to have an internship in the IT Change Management Department of Co-operative Financial Services/Britannia Building Society.
It feels full circle that I am now a software engineer at JPMorganChase, working in Infrastructure Platforms, Databases Department.
How did you start using Django?
While living in Lawrence, I visited the Lawrence Public Library often. I would sometimes drive past the nearby Lawrence Journal World and had no idea that Django was being invented there.
During my internship at CFS/Britannia Building Society in England, I was immersed in technology and loved it. Although it was a tumultuous time due to the subprime mortgage crisis, I was left with an insatiable curiosity about programming. That is how I learned about Django, and I have been using Django ever since.
What other framework do you know and if there is anything you would like to have in Django if you had magical powers?
In addition to Python/Django, I work with React.
At DjangoCon US 2025, Will Vincent commented during his talk "Django for AI" that Django "never really 'owned'" the niche of classic Machine Learning models, but should have, because it's great for small and medium ML models. He recently asked Django Project Forum if Django should have an official skills.md like FastAPI now has. These are important conversations to have.
If I had magical powers, I would maintain the stability and maturity many Django users celebrate while making targeted enhancements to help it better serve developers who are reaching for FastAPI or JavaScript frameworks first. Providing Django's benefits while meeting the use case is win-win.
Django already supports many modern patterns. Clear starter guides and code examples showing how to build a classic ML application, LLM chat bot, async workflows, React/Angular/Vue integration, and APIs, while taking advantage of the benefits Django offers, could help developers discover it better.
Marlene Mhangami and Benjamin "Zags" Zagorsky also gave some ideas for how to approach this in their respective DjangoCon US 2025 keynotes.
Author's note: You can watch Marlene Mhangami's keynote and Benjamin "Zags" Zagorsky's keynote here.
What projects are you working on now?
In my work, I am part of a team building a new on-premises caching service from the ground up. I design distributed system topology, write code for a React UI and Django control plane that orchestrate tasks to provision these distributed systems based on internal customer requirements, create Ansible playbooks to manage the servers, and do Red Hat Enterprise Linux admin. It's not a typical Django use case, but fun and fascinating in its own right.
Which Django libraries are your favorite (core or 3rd party)?
I had a website query that was becoming progressively slower as the data in the database grew. I installed django-silk, a live profiling and inspection library, diagnosed an N+1 problem, and had an aha moment as I watched the number of SQL queries in the django-silk dashboard greatly reduce with each new addition of a prefetch_related or select_related. It felt like magic. django-silk has been one of my favorite libraries ever since.
htmx and django-template-partials have been a joy to use together to create AJAX-like web UI functionality directly in HTML, without the need for JavaScript. As of Django 6.0, the Django Template Language now supports template partials. The htmx website has a fun UI Examples page to demo what it can do.
I am a fan of django-ninja. I like its use of Pydantic schemas, type hinting, and OpenAPI integration.
What are the top three things in Django that you like?
-
Django was invented at a newspaper. The Django ORM and admin are arguably its killer feature. Not every popular framework has a built-in ORM and admin that enable users to quickly structure and manage data.
-
Django's "batteries included" philosophy and rich library ecosystem enable developers to focus on building applications without re-inventing the wheel.
-
Django has strong security protections out of the box and a mature security policy.
I'm curious, how did you started to contribute to DjangoCon US? Do you have any advice for someone who might be considering joining the board of directors if the opportunity arose?
While looking through GitHub projects, I stumbled upon the DjangoCon US website code. I had a feeling that becoming part of a community like this would be life-changing, and it was. In March of 2016, I began helping with the DjangoCon US 2016 website. It was an invaluable opportunity to learn my way around Git, GitHub, and the website code. 2017 was a very eventful year. I became the DjangoCon US 2017 Website Chair, joined the DEFNA Board, and was hired by the web development agency contracted to create the DjangoCon US website.
I served as DjangoCon US Website Chair or Co-chair from 2017 to 2021 and DEFNA Board Member from 2017 to 2025, including several years as corporate secretary. Serving on the board gives you the opportunity to manage the higher level details of DjangoCon US, such as budgeting, location selection, contractor procurement, and volunteer oversight. You will also have the opportunity to grow Django outreach across North America, for instance, by awarding event grants. Being on the board was an honor and one of the most rewarding experiences of my life.
I've never seen a more practical write-up of how to excel in a board position than former DEFNA President Jeff Triplett's post "PSF Elections how I am voting.".
You have been a speaker, an organizer of DjangoCon US, and a member of DEFNA’s board of directors. Having observed the conference from many different perspectives over a period of time, how do you think DjangoCon US has evolved?
The conference structure has evolved to fit the times and talk subject trends have evolved (async, locality of behavior ecosystem, and AI come to mind), but my favorite evolution of all has been the major improvement in diversity and inclusion over time.
DjangoCon US increased the number of talks by women from around 6% in 2010 to nearly 50% in 2016. This was accomplished through intentional outreach. PyLadies and Django Girls have both played a major role.
In 2023, the conference was an important platform for the newly formed, self-organized Black Python Devs organization. By one organizer's count, we had around 10 Black speakers, and a Django Girls workshop had a majority of Black participants. In 2024, the conference hosted the Black Python Devs Leadership Summit.
From a Django Core perspective, at DjangoCon US 2018, former Django Fellow Carlton Gibson acknowledged that the community had become more diverse than ever, but the core contributors had continued to be white guys. The launch of Djangonaut Space in 2024 by a small group of community members has been a game changer. Djangonaut Space is a highly effective mentorship program that equips its cohort members to contribute to Django and its ecosystem, with a focus on inclusion.
You have been a speaker multiple times, do you have any advice for someone considering starting speaking one day?
My advice to aspiring public speakers is to start with the opportunities you can get and work your way up: give a presentation to your department (do a practice run to colleagues for feedback), give a talk to a local meetup, give a lightning talk at a conference, enlist the help of a talk mentor and submit to a conference CfP (especially those that welcome newcomers - DjangoCon US is one of them), and don't be discouraged by rejections.
As a conference attendee, I've seen some incredible speakers. Russell Keith-Magee immediately comes to mind. I appreciate the candor of highly effective public speakers who acknowledge that it is a skill that can be developed. I often remember an anecdote Nina Zakharenko once told. She got her start in public speaking when someone challenged her to do a lightning talk at a conference. She got the microphone caught in her hair during the talk. Years later, she expertly keynoted PyCon US. Don't wait for, or expect perfection.
After so many times in the Django community, what makes you stay?
I enjoy the Django tool ecosystem, and the people are wonderful. I have a lot of friends in this community who inspire me and are there for me.
How do you envision the future of Django from your perspective?
Last year was Django's 20th birthday. I’m optimistic that Django and its community will be thriving 20 years from now.
Do you remember your first contribution to Django and in open source? (Can be Django ecosystem, code contribution or not)
At DjangoCon US 2019 sprints, I made my first contribution to Django Core with the help of Carlton Gibson. I added instructions for running tests using django-docker-box. I would love to contribute to Django again.
What are your hobbies or what do you do when you’re not working?
In my personal time, I love exploring new and interesting places, discovering great food, watching documentaries, and taking photographs.
Is there anything else you’d like to say?
Thank you for having me! I really enjoyed this interview.
Thank you for doing the interview, Kati !
PyCharm
PyTorch Tutorial for Deep Learning
This is a guest post from Naa Ashiorkor, a data scientist and tech community builder.
Building intelligent systems that can see, hear, understand language, and make decisions was previously the domain of specialized researchers with massive computing resources only – today, deep learning has made this accessible to developers and data scientists across the world, bringing the ability to build, train, and deploy AI models within reach.
This accessibility can be credited to deep learning frameworks, and one such framework is PyTorch, which has rapidly become the prevailing choice across both research and industry. PyTorch is an open-source deep learning framework built in Python and designed to make building neural networks intuitive.
Curious about how neural networks actually learn? In this tutorial, you’ll build your first PyTorch model using the MNIST dataset in PyCharm and see it recognize handwritten digits in real time. Along the way, you’ll get familiar with tensors and understand the core workflow behind building deep learning models.
What is PyTorch?
PyTorch traces its roots to Torch, a scientific computing framework that used Lua; in 2016, researchers at Facebook’s AI Research Lab (FAIR), now Meta AI, reinvented it for Python, creating PyTorch, which is today a Linux Foundation community project.
By 2024, PyTorch had established itself as the most popular deep learning framework, with a 63% adoption rate in the model training space, used in over 70% of AI research implementations. In 2025, the PyTorch Foundation’s ecosystem grew to include large-scale projects such as vLLM, DeepSpeed, and Ray, all of which are governed independently.
The annual PyTorch Conference attracted more than 3,400 attendees and gained 16 new industry members, including Snowflake, Dell Technologies, and Qualcomm. Also, it is trusted in production by organizations such as Meta, Microsoft, OpenAI, and Tesla. For developers and data scientists looking to enter deep learning, PyTorch remains the most practical and widely supported starting point available today.
PyTorch was built on two foundations: GPU-accelerated tensor computation as a more powerful alternative to NumPy and an automatic differentiation engine for training neural networks.
From these foundations, PyTorch has grown into one of the most fully featured deep learning frameworks available. Its core features include:
- Dynamic computation graphs (define-by-run): As code executes, PyTorch builds computation graphs. These are maps of every mathematical operation your model performs: things like multiplying inputs by weights, adding biases, and applying activation functions. PyTorch needs to track these because training requires working backwards through all of those steps to calculate how much each weight contributed to the model’s error, so it knows how to adjust them to improve. Computation graphs allow the model structure to be modified during runtime and facilitate debugging using standard Python tools, making PyTorch ideal for research and experimentation.
- Pythonic and intuitive interface: PyTorch code is Pythonic, which reduces the learning curve. It uses standard Python control flow and clean, readable syntax, and it integrates well with Pythonic libraries.
- Strong GPU acceleration: PyTorch has seamless support for GPUs using CUDA. There is easy device switching and efficient tensor computations on GPUs. It also supports multi-GPU training.
- Autograd (automatic differentiation): There is a built-in autograd engine that automatically computes gradients. It tracks operations on tensors and enables backpropagation with minimal code.
- Rich neural network library: PyTorch provides a comprehensive module for building models. There are prebuilt layers, loss functions, activation functions, and a modular design for custom architectures.
- Extensive ecosystem: PyTorch is not just a framework – it is an ecosystem. There is a wide array of tools, even beyond the AI-specific libraries. Hence, an entire AI project can be managed under the Python umbrella from data collection to deployment.
- Model deployment support: PyTorch supports deploying models from research to production, with support for both mobile and edge deployments. What’s more, it also has TorchScript for optimized execution and ONNX export for interoperability.
- Broad community and industry adoption: PyTorch is backed by Meta, and it has a large and active community. Due to Python being one of the largest programming communities worldwide, PyTorch users benefit from shared knowledge, resources, and tools. There is extensive documentation and tutorials, and it is widely used in academia and industry.
For a broader perspective on how PyTorch and TensorFlow differ, and when to choose each, check out this blog post.
Why use PyTorch for deep learning projects?
PyTorch is at the core of the current deep learning ecosystem. In recent years, it has been the framework behind some of the most influential AI models, such as Meta’s Llama, OpenAI’s early GPT models, and Stable Diffusion. Today, it is a popular choice for AI research worldwide.
With a 63% adoption rate, PyTorch is the industry leader in model training, according to the Linux Foundation’s Shaping the Future Generative AI report. In academia, it is highly used in research paper implementations. It is preferred for research and development because of its intuitive design, which allows for easy experimentation and iteration.
Hence, researchers can develop novel architectures and test ideas simultaneously. PyTorch powers 85% of deep learning papers presented at top AI conferences.
PyTorch is a framework of choice due to its advantages:
- Debugging with PyTorch is straightforward and natural since it runs as ordinary Python. Due to its dynamic graphing and real-time execution, developers can test and make changes to models using standard Python tools like print statements and debuggers – no special setups or workarounds are required. This sets PyTorch apart significantly from static-graph frameworks, where errors mostly emerge at runtime, and it can be challenging to trace them back to their source.
- PyTorch is flexible due to its dynamic computation graph and intuitive API, so it is ideal for experimentation and rapid iteration.
- PyTorch has a thriving community. According to the PyTorch 2024 year in review, there were contributions from more than 3,500 individuals and 3,000 organizations in a single year, and its tooling ecosystem grew by over 25%. The community has built up a huge library of tutorials, pre-trained models, and extensions. In particular, Hugging Face’s Transformers library, built directly on top of PyTorch, is now the standard toolkit for NLP research and development.
Understanding PyTorch tensors
Understanding PyTorch requires an understanding of tensors. Every input, output, and model weight in PyTorch lives inside a tensor. Hence, tensors are not just a data format; they are the medium through which all computation flows.
Tensors are the core data structure in PyTorch. They are like n-dimensional arrays and matrices, but unlike regular arrays, tensors can be used on hardware accelerators like GPUs. Think of tensors as an extension of numbers we are already familiar with. A single number is a zero-dimensional tensor, a list of numbers is a one-dimensional tensor, and a table of numbers is a two-dimensional tensor. From there, you can add more dimensions to represent complex data like images, videos, or audio.
Neural networks accept tensors as input and generate tensors as output – even the parameters of a neural network, its weights and biases, are stored as tensors. For a visual explanation, you can watch a beginner-friendly video on tensors and deep learning:
Tensors are similar to NumPy arrays but can also run on GPUs or other hardware accelerators. Often, tensors and NumPy arrays can share the same underlying memory, meaning that data doesn’t need to be copied.
The main difference is what happens when the calculation gets serious. NumPy is for scientific computing on a CPU. PyTorch tensors can be moved and processed on GPUs in one line of code, allowing for massive parallel computation and providing significant speedups for the types of matrix multiplication common in deep learning.
This enables the kind of processing that makes training large neural networks possible.
There are basic operations with PyTorch tensors that are essential. You can view the full implementation in this GitHub repository.
Creating a tensor
The first thing you need to know is how to create a tensor. PyTorch gives you several ways depending on what your data looks like – you can build a tensor from an existing list, initialize one filled with zeros or ones as a placeholder, or generate one with random values as a starting point for a model’s weights.
import torch

# From a list
x = torch.tensor([1.0, 2.0, 3.0])

# Filled with zeros or ones
zeros = torch.zeros(3, 3)
ones = torch.ones(3, 3)

# Random values
rand = torch.rand(3, 3)

print(x)
print(zeros)
print(ones)
print(rand)
This code snippet demonstrates different ways to create tensors in PyTorch. A tensor is created from a Python list, alongside tensors filled with zeros and ones, and a tensor containing randomly generated values. The output displays the resulting tensor structures and values, illustrating common methods used to initialize tensors for deep learning workflows.
Basic arithmetic
Tensor arithmetic works element-wise, meaning PyTorch applies the operation across every value in the tensor simultaneously rather than looping through one by one. This is what makes tensors so fast – and it is also what makes GPU acceleration so powerful, since GPUs are specifically designed to run thousands of these operations in parallel.
a = torch.tensor([1.0, 2.0, 3.0])
b = torch.tensor([4.0, 5.0, 6.0])

print(a + b)
print(a * b)
print(a.sum())
print(a.mean())
This code snippet demonstrates common mathematical operations on PyTorch tensors. Two tensors are added and multiplied element-wise, while functions such as sum() and mean() are used to compute the total and average values of the tensor elements. The output displays the results of these operations, highlighting how PyTorch efficiently performs numerical computations on tensor data.
Reshaping
In deep learning, you will constantly need to reshape tensors – for example, flattening a 2D image into a 1D vector before passing it into a fully connected layer or reorganizing a batch of data to match what a model expects as input. PyTorch makes this straightforward with reshape(), which rearranges the data into a new shape without changing the underlying values.
x = torch.ones(6)
x_reshaped = x.reshape(2, 3)
print(x_reshaped.shape)
This code snippet demonstrates how to change the shape of a tensor using the reshape() function. A one-dimensional tensor of ones containing six elements is reshaped into a 2×3 tensor. The output shows the updated tensor structure, confirming that the data has been reorganized without altering its values.
Moving to GPU
By default, tensors are created on the CPU, but moving them to a GPU – where matrix operations can run orders of magnitude faster – takes just one line. This allows the same code to run on both GPU-equipped machines and machines that only have a CPU. It is good practice to check whether a GPU is available.
if torch.cuda.is_available():
   x = x.to("cuda")
This code checks whether a CUDA-enabled GPU is available using torch.cuda.is_available(). If a GPU is available, the tensor x is moved from the CPU to the GPU using .to("cuda"). This enables faster computation by leveraging GPU acceleration, which is especially useful for large-scale deep learning tasks.
Converting to and from NumPy
PyTorch and NumPy use nearly the same language, so switching between them is simple. Chances are you are already using NumPy somewhere in your pipeline – for loading data, preprocessing, or visualizing results.
PyTorch is designed to work alongside it seamlessly. You can convert between tensors and NumPy arrays in one line, and on the CPU, they even share the same memory, so there is no performance cost to switching between them.
import numpy as np

# Tensor to NumPy
tensor = torch.tensor([1.0, 2.0, 3.0])
numpy_array = tensor.numpy()

print("Original PyTorch tensor:")
print(tensor)

print("\nConverted to NumPy array:")
print(numpy_array)

# NumPy to Tensor
numpy_array = np.array([1.0, 2.0, 3.0])
tensor = torch.from_numpy(numpy_array)

print("\nOriginal NumPy array:")
print(numpy_array)

print("\nConverted to PyTorch tensor:")
print(tensor)
This snippet demonstrates interoperability between PyTorch and NumPy. A PyTorch tensor is first converted into a NumPy array using .numpy(), and then a NumPy array is converted back into a PyTorch tensor using torch.from_numpy(). The output shows that the values remain unchanged during the conversion process, highlighting seamless data sharing between the two libraries. This is particularly useful when integrating PyTorch models with NumPy-based preprocessing or analysis workflows.
Setting up PyTorch
PyCharm streamlines deep learning setup by integrating directly with Python environments and package management tools. One of its key strengths is its seamless integration with Jupyter notebooks and optional Google Colab support, allowing you to switch between local and cloud-based computation effortlessly.
Before creating the project, it is important to install uv, a fast Python package and environment manager, locally. This enables PyCharm to create and manage project-specific environments using uv directly from the Python interpreter settings.
The setup process begins by creating a new project, where a project-specific Python environment is configured through the Python interpreter settings. During this step, a uv-managed environment and a Jupyter notebook are selected, too, enabling an interactive development environment from the beginning.
Version control can also be initialized using Git within this same window. For a detailed guide on creating and working with Jupyter notebooks in PyCharm, refer to the PyCharm documentation.
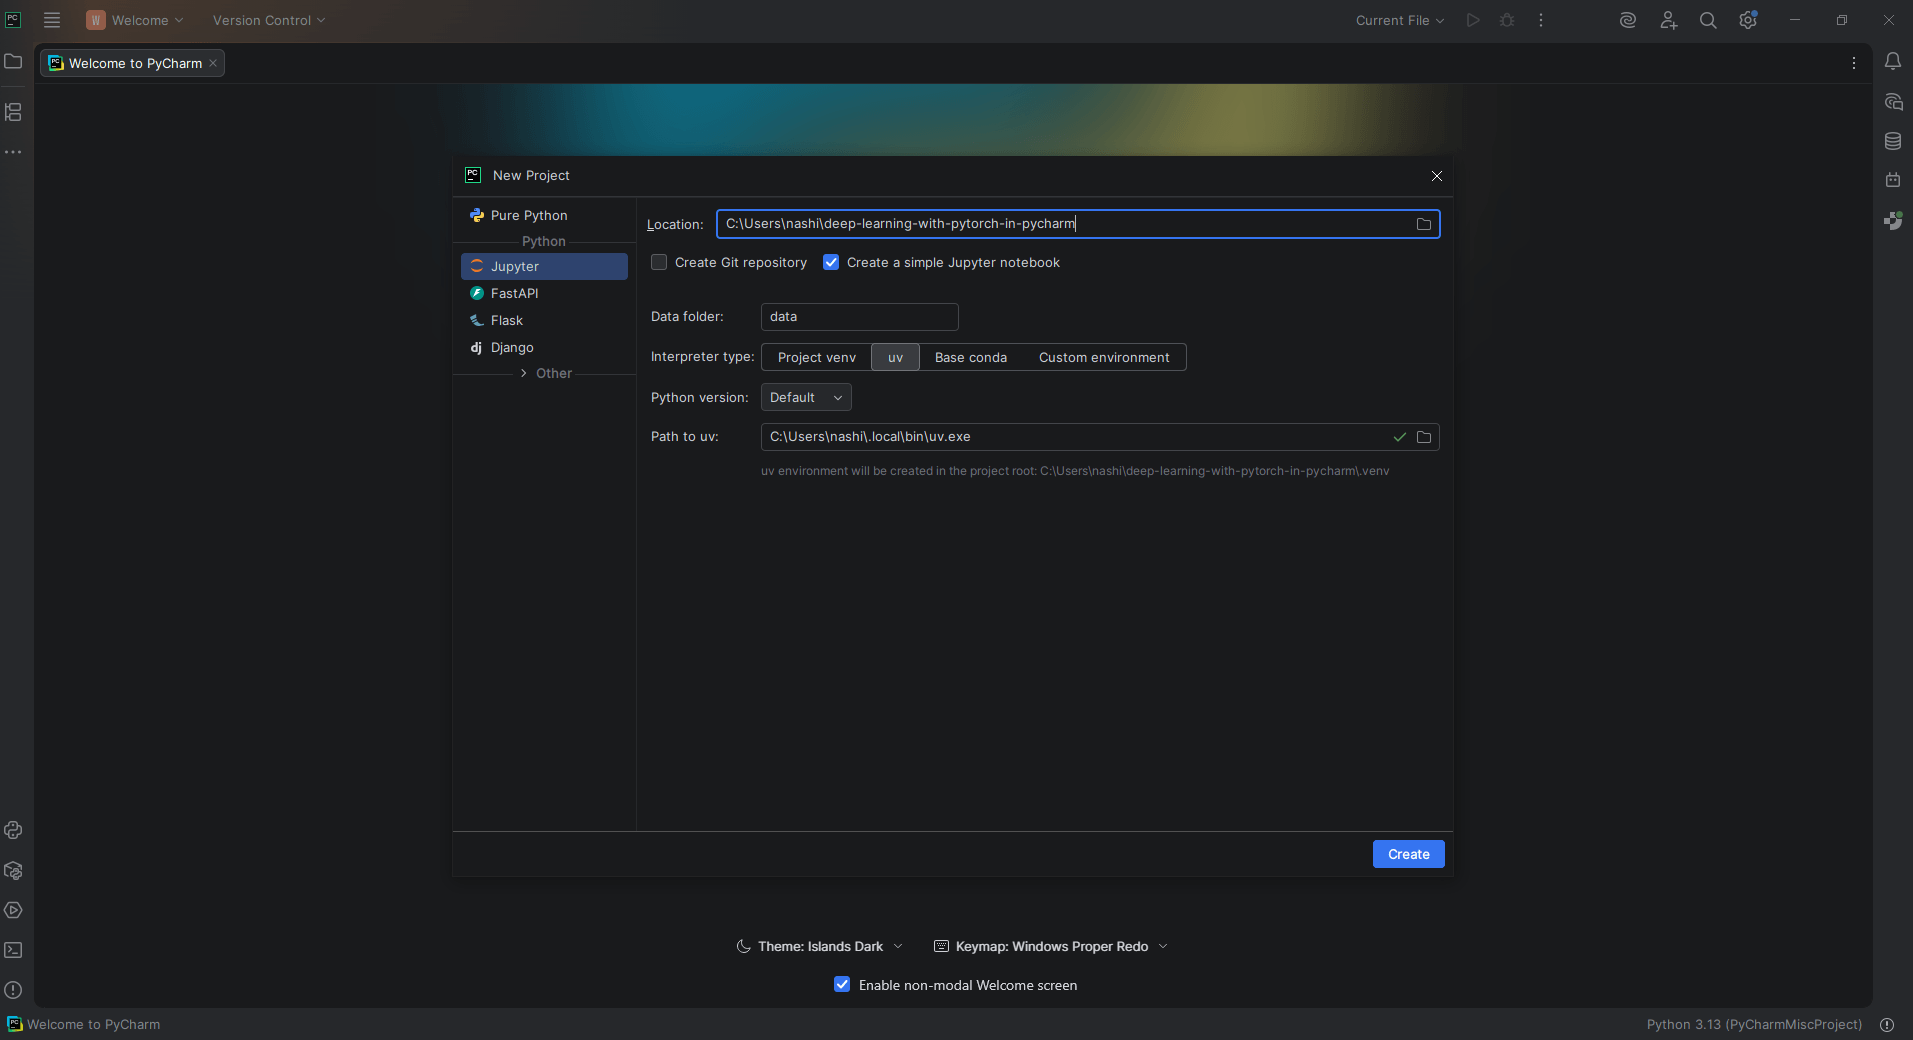 From the PyCharm Welcome screen, click New Project. In the project configuration window, select Jupyter as the project type and choose uv as the environment manager under the Python interpreter settings. This creates a project-specific environment managed by uv and prepares the project for interactive deep learning development.
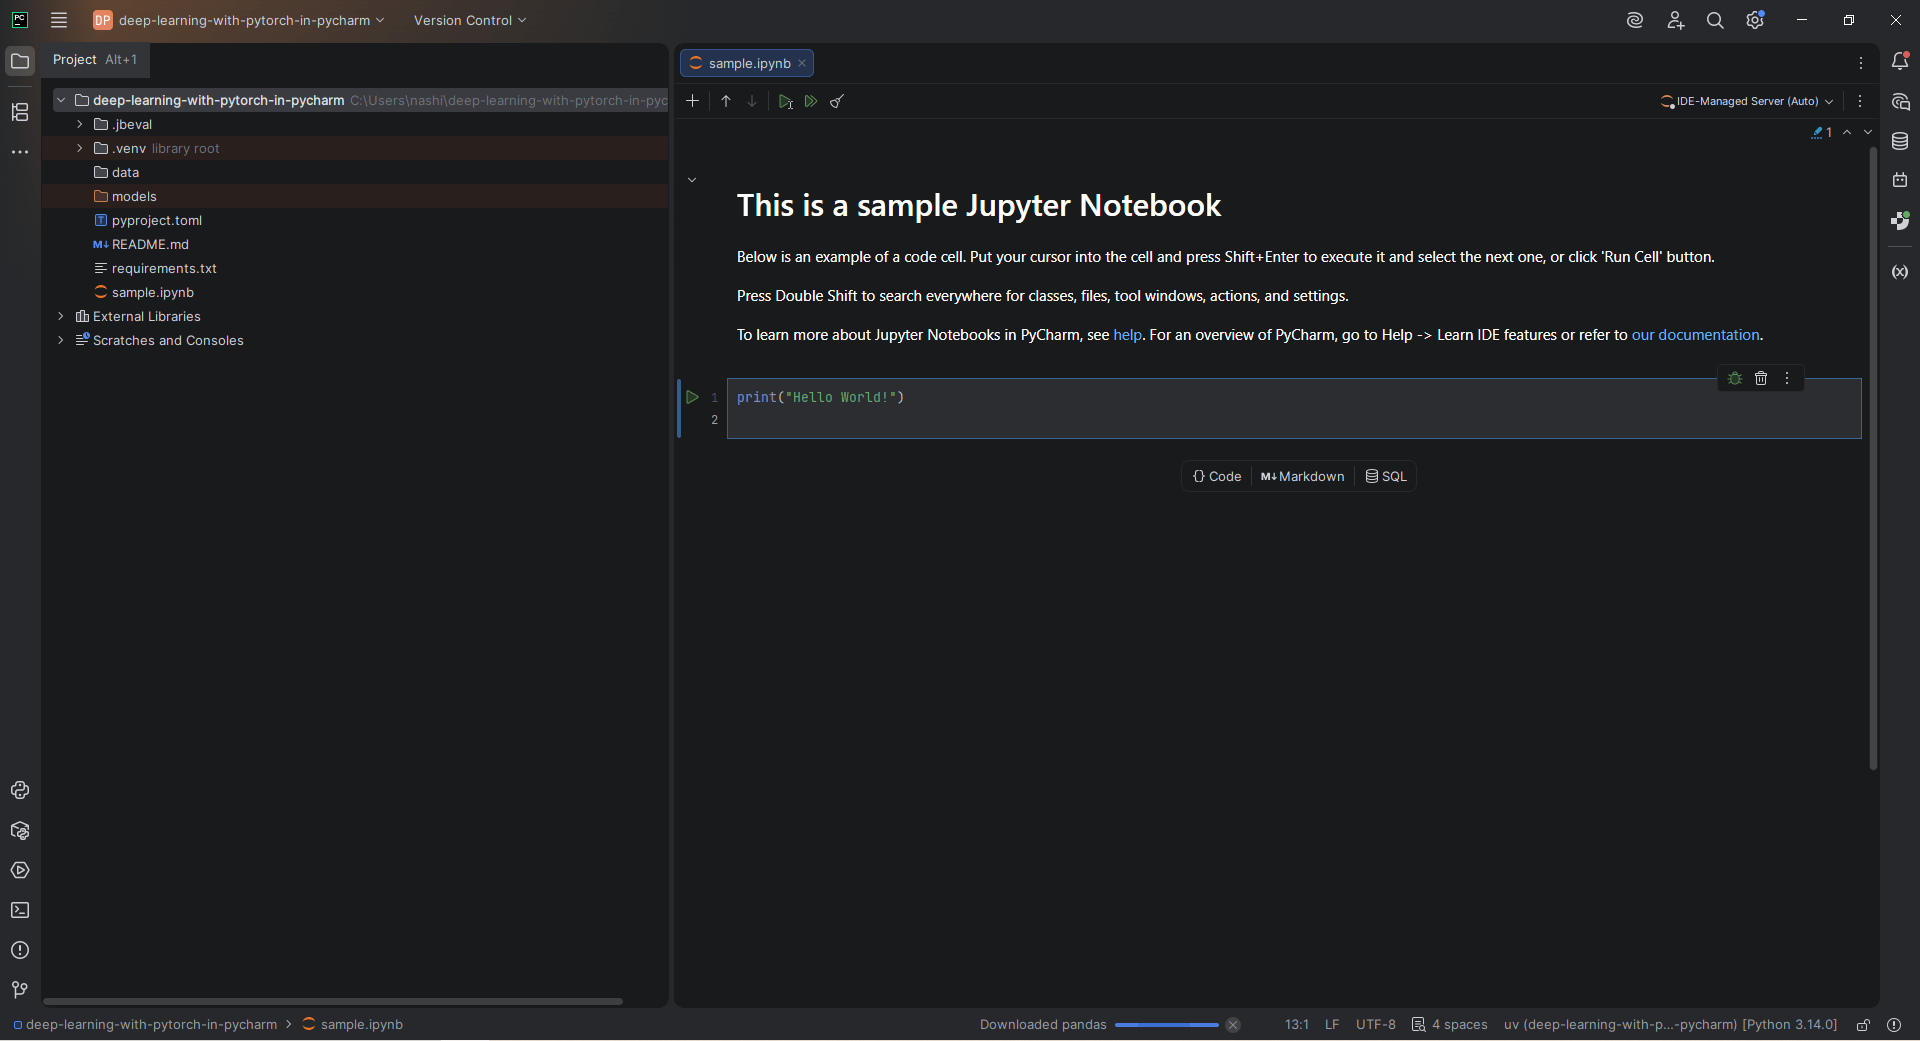 After the project is created, the selected Python interpreter is displayed in the bottom-right corner of the PyCharm window. The interpreter name should indicate that it is a uv-managed environment, confirming that the project is configured to use uv for package and environment management.
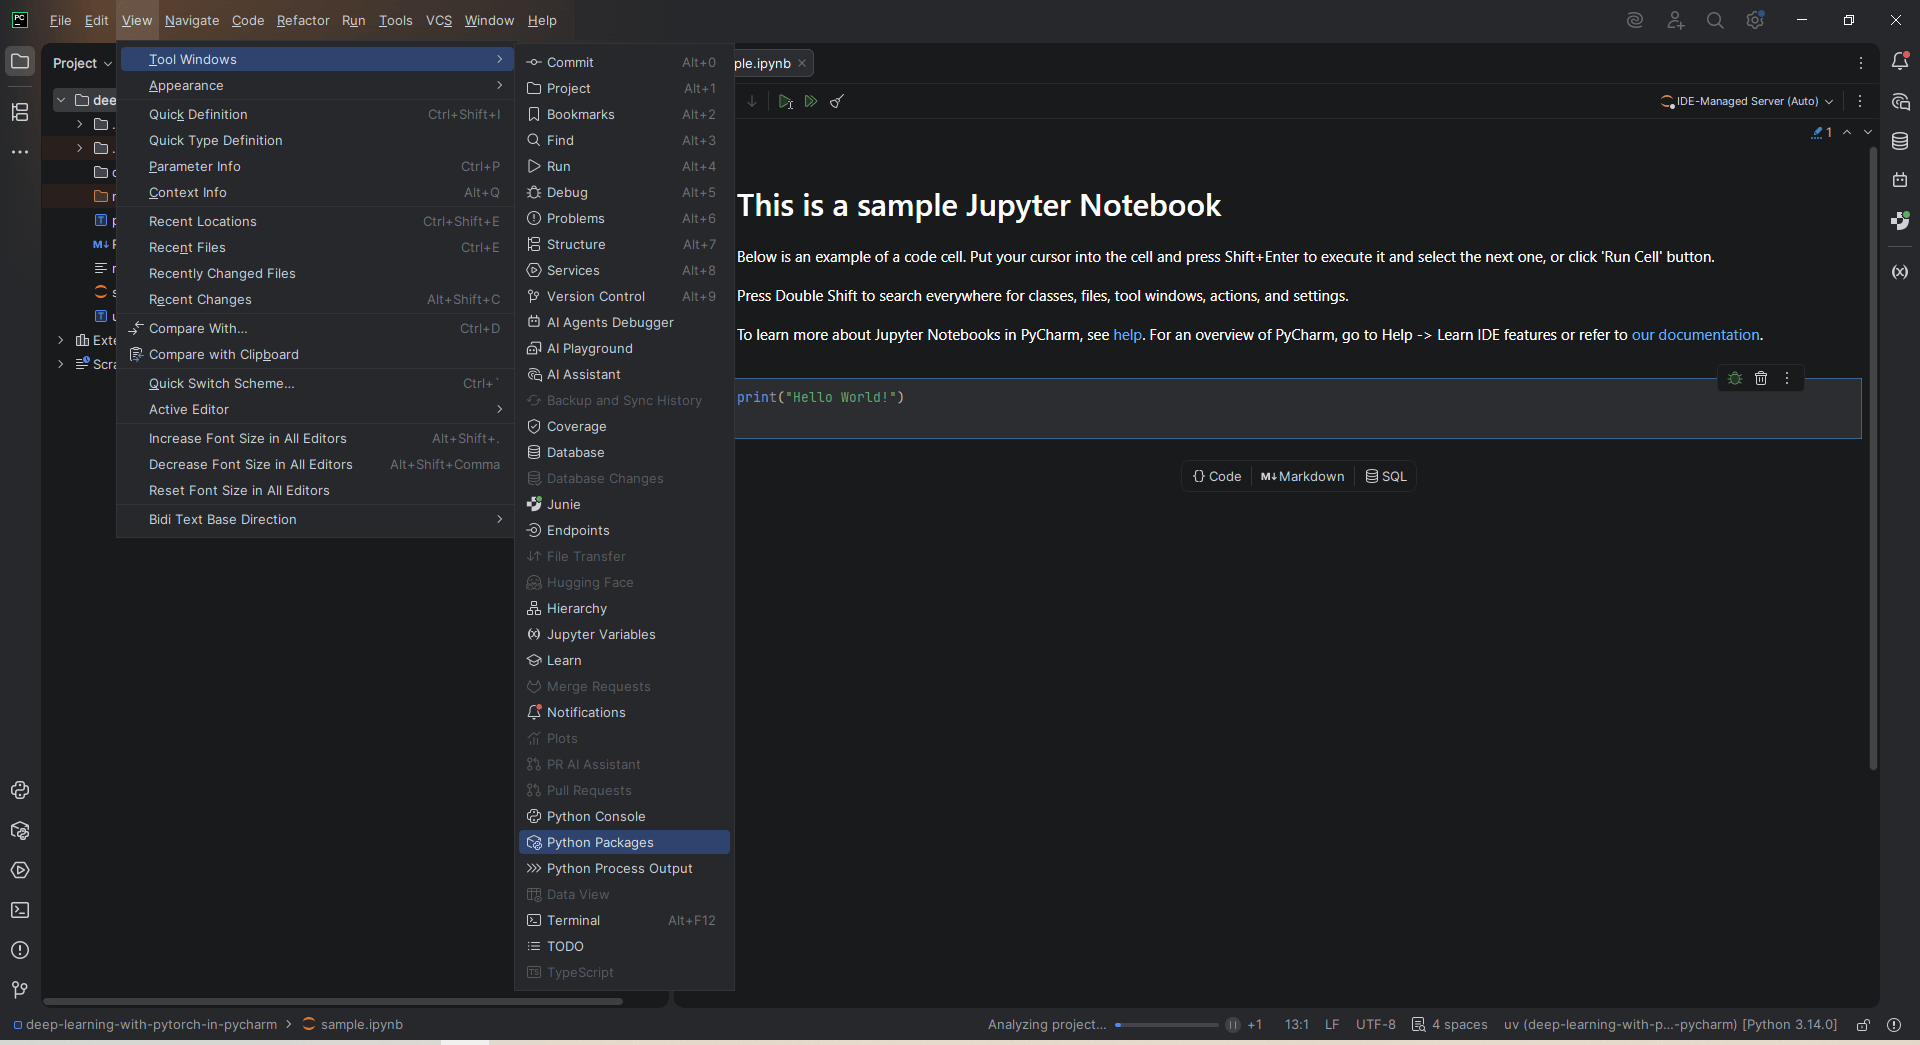 To install PyTorch using PyCharm’s graphical interface, open the package manager by navigating to View | Tool Windows | Python Packages. The Python Packages tool window provides a convenient way to search for, install, upgrade, and remove packages without using the terminal.
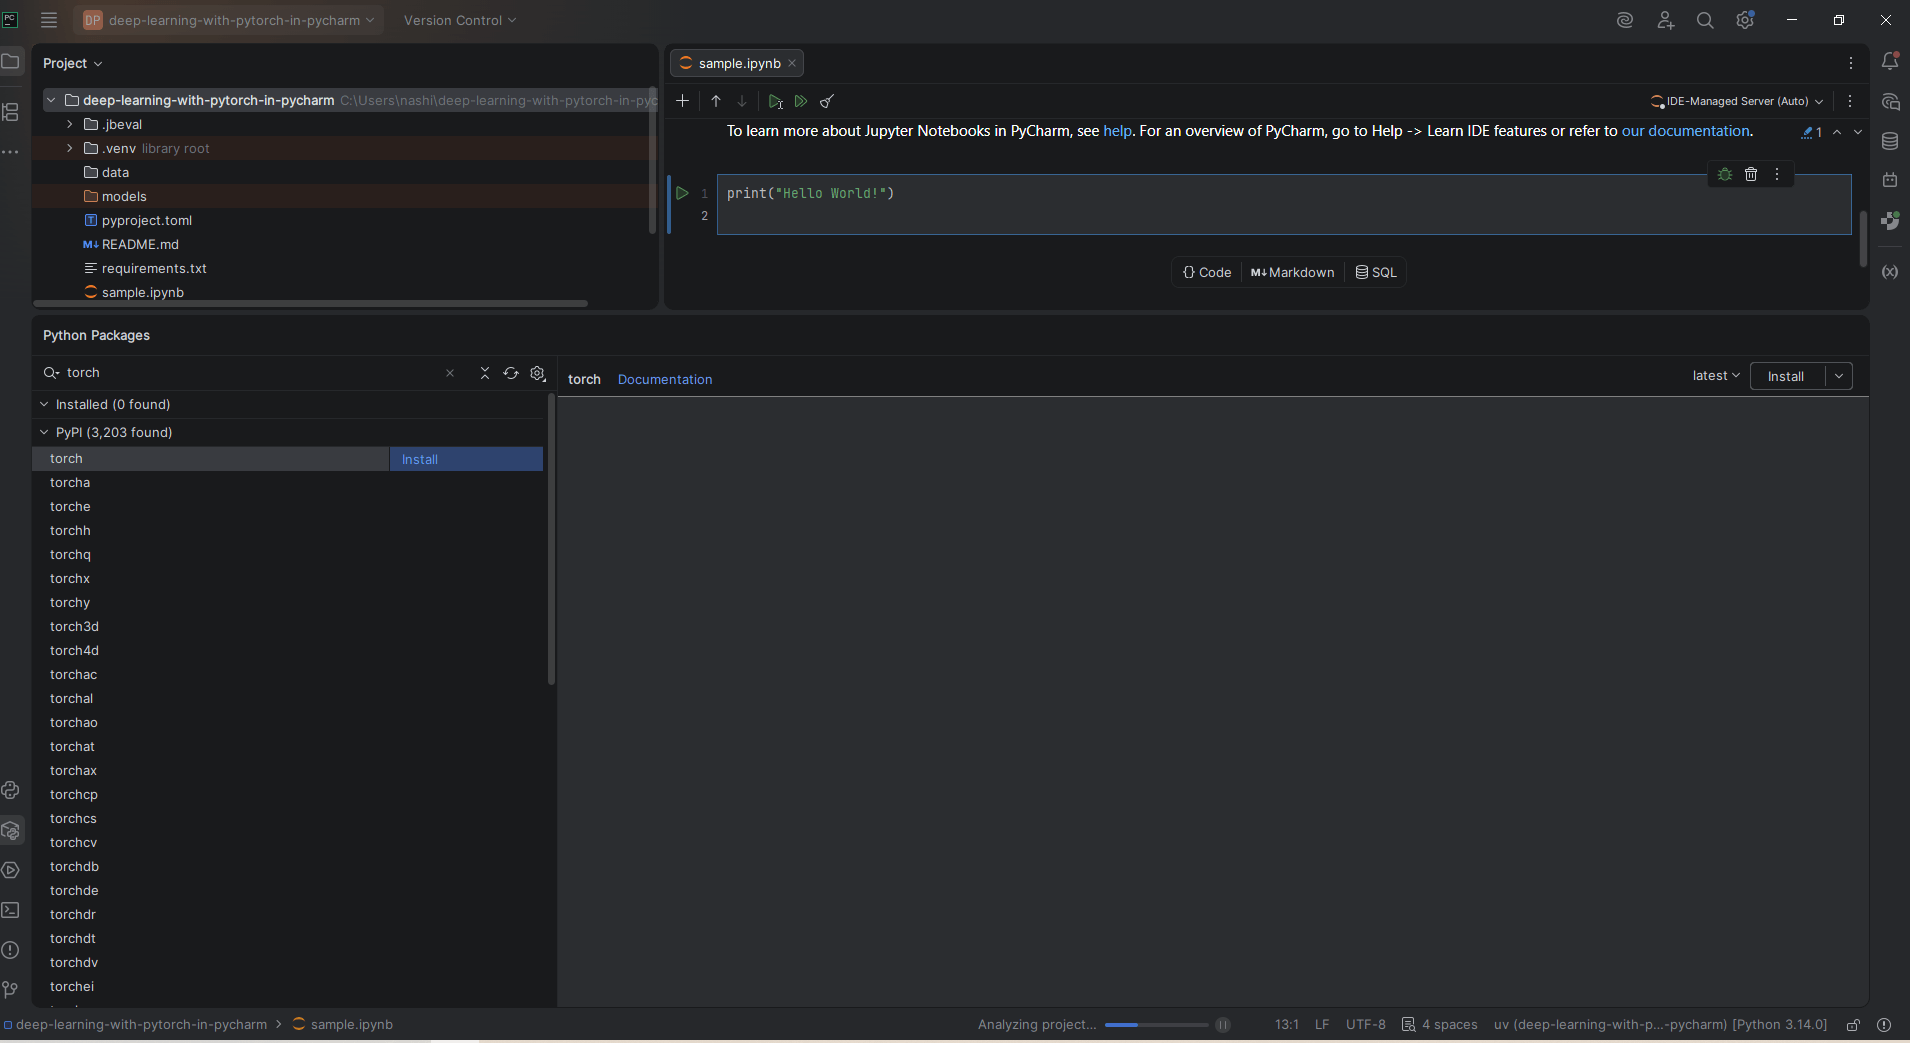 With the Python Packages tool window open, enter “torch” in the search bar to locate the PyTorch package. Select the package from the search results and click Install. The same process can be used to install related packages such as torchvision and torchaudio into the uv-managed project environment.
Using Conda as an alternative
If a Conda environment is preferred, PyCharm supports Conda directly through the Python interpreter settings. A Conda environment can be selected when setting up the project, and PyCharm will manage it automatically. Refer to the PyCharm documentation for Conda environments for more details on configuring them.
Once the Conda environment is active, install PyTorch using the terminal:
conda install pytorch torchvision torchaudio pytorch-cuda=12.1 -c pytorch -c nvidia
For PyTorch development, I recommend PyCharm because it provides excellent support for Python, intelligent coding assistance, debugging, version control, integrated database management, and seamless Docker integration. Specifically for data science, PyCharm supports Jupyter notebooks and key scientific and machine learning libraries and integrates with tools like the Hugging Face models library, Anaconda, and Databricks.
Additionally, it is particularly well-suited for PyTorch development because it understands the framework and includes features for layer-by-layer inspection of PyTorch tensors, which is essential when exploring data and building deep learning models.
Beyond tensors, PyCharm allows you to set breakpoints in training loops, inspect tensor values, and step through model forward passes using the integrated debugger – which works naturally with PyTorch’s dynamic computation graphs.
Building neural networks with PyTorch
A neural network is a system of connected layers that learns patterns from data by adjusting its internal weights through training. In PyTorch, all of these layers are contained within a single module called torch.nn . Think of it as your construction toolkit, which gives you everything you need to assemble a network without writing low-level mathematical operations from scratch.
torch.nn comes with a library of predefined layers, such as nn.Linear for fully connected layers, nn.Conv2d for convolutional layers, and nn.LSTM for recurrent layers. Hence, you can focus on designing your network rather than implementing the math behind each layer. It provides all the building blocks needed to build your own neural network.
Every module in PyTorch subclasses nn.Module. As a neural network is itself a module that consists of other modules (layers), this nested structure allows for easily building and managing complex architectures.
When you build a neural network in PyTorch, you create a Python class that inherits from nn.Module and implements two core methods:
__init__() –where you define your layers.forward() –where you define how data flows through those layers.
PyTorch’s autograd system automatically builds the computation graph based on the operations performed in the forward method, enabling automatic differentiation. The backward method, which handles gradient computation, typically does not need to be implemented manually. That means PyTorch handles the math behind gradient calculations, so you can focus on building.
Model building involves more than understanding the code. There are practicalities that need to be considered.
- Constant iteration. There is a very high probability that your first model will not perform well. That is normal because deep learning is an experimental process that involves adjusting layers, activation functions, and hyperparameters until the model improves.
- Simplicity first, then complexity. A two-layer feedforward network is always a good starting point. It is advisable to add complexity, such as additional layers and different architectures, when it is clear that the simple model is insufficient.
PyCharm makes model building easier thanks to its integrated debugger. You can set breakpoints inside your forward method, inspect tensor values at each layer, and add step-throughs of your model pass by pass, which drastically reduces the time it takes to identify and fix problems.
Build your first PyTorch handwritten digit classifier
In this section, you will build a simple neural network in PyTorch that can recognize handwritten digits from the MNIST dataset. You will work through the complete workflow, starting from raw image data; you will prepare and normalize the dataset, define a neural network, train it to recognize digits, and evaluate how well it performs on test data.
Along the way, you will explore key deep learning concepts such as tensors, layers, activation functions, loss functions, optimization, and training loops, while using PyCharm to inspect and understand what happens inside the training loop.
In deep learning, image classification is a foundational task, in which a model learns to assign a label to an image based on its visual content. In this example, we’ll use image classification on the MNIST database of handwritten digits, a classic benchmark in computer vision that consists of 28 x 28 grayscale images of handwritten digits from 0 to 9.
It is small and well-structured, and using it as an example gives us the opportunity to focus on understanding the core building blocks of deep learning. The aim is to build a neural network using PyTorch that can accurately recognize and classify these digits.
The complete source code for this project is available in the accompanying GitHub repository.
 MNIST dataset (source)
Preparing the data
Before training any model, the data needs to be loaded, cleaned, and formatted so PyTorch can work with it efficiently. PyTorch provides two classes that handle this:
Datasetdefines how individual samples are accessed and returned.DataLoadertakes aDatasetand handles how data is fed into the model during training, including batching, shuffling, and parallel loading.
As these components are configured, PyCharm helps streamline development through features such as code completion, automatic import suggestions, parameter hints, and quick documentation.
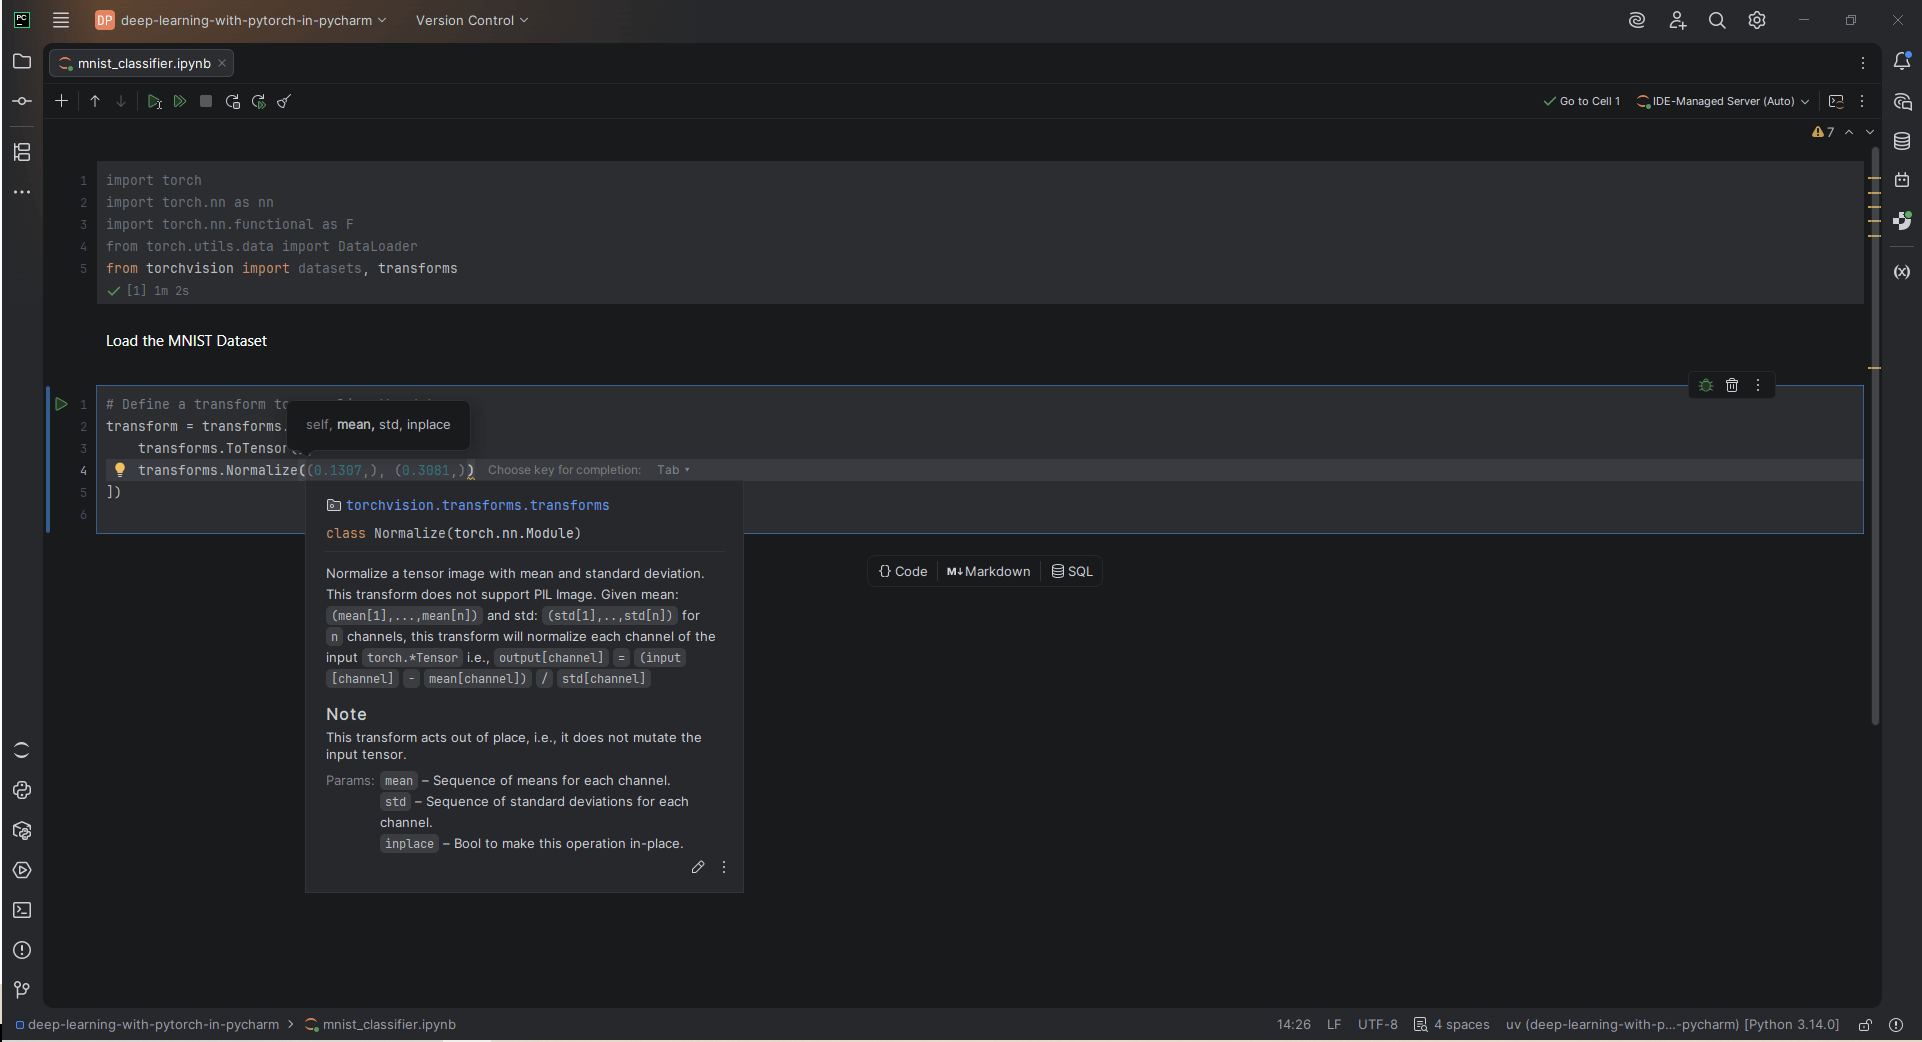
Hovering over PyTorch classes and functions shows usage information, and pressing Ctrl+Q opens detailed documentation directly within the IDE. Hence, it is easier to explore PyTorch APIs and correctly configure data loading and preprocessing steps without frequently switching to external documentation.
 As
As transforms.Normalize() is typed, PyCharm displays the function signature and parameter information directly in the editor, helping developers configure data preprocessing steps more efficiently without referring to external documentation.
Loading and normalizing the data
Before training a neural network, the input data needs to be normalized so that the pixel values are scaled into a consistent range. This helps improve stability by keeping input values centered around zero and ensuring that gradients behave more predictably during optimization.
# Download and load the training data
train_data = datasets.MNIST(
   root='./data',
   train=True,
   download=True,
   transform=transform
)
The code snippet above downloads the MNIST dataset (if needed), loads the training images, and applies preprocessing so that the data is ready to be used in a neural network.
In this project, MNIST images are normalized as part of a preprocessing pipeline using PyTorch transforms:
transforms.ToTensor()converts images from pixel values (0–255) into floating-point tensors scaled to 0–1.transforms.Normalize((0.5,), (0.5,))then rescales these values to approximately -1 to 1, which helps stabilize training by keeping input values centered around zero and improving gradient behavior during optimization.
PyTorch also provides key data-loading parameters to control how training data is processed:
batch_size=64means the model processes 64 images at a time instead of the full dataset. This improves memory efficiency and makes training more stable by allowing gradient updates on mini-groups of data rather than individual samples or the entire dataset.shuffle=Truerandomizes the order of images each epoch, so the model does not memorize the sequence.download=Truemeans PyTorch fetches MNIST automatically on the first run, so you do not need to download anything manually.
Defining the model
After the data is ready the next step is to build the neural network that will learn from it. The goal of the model is to take an input image of a handwritten digit and predict which digit (0–9) it represents. Each MNIST image is 28×28 pixels. Since the model cannot directly interpret images the way humans do, we first flatten each image into a single vector of 784 values (28 x 28 = 784). This converts the 2D image into a format the model can process.
The input layer takes the 784 pixel values and passes them through fully connected layers. Each layer learns weighted combinations of features that become increasingly useful for distinguishing digits. While these representations are not explicitly interpretable, the network gradually learns patterns that help separate different classes.
To help the model learn effectively, we use an activation function called ReLU, which allows the network to capture non-linear patterns that are essential for understanding images.
class SimpleNetwork(nn.Module):
   def __init__(self):
       super(SimpleNetwork, self).__init__()
       self.fc1 = nn.Linear(784, 128)  # 28x28 = 784 input pixels
       self.fc2 = nn.Linear(128, 64)   # hidden layer
       self.fc3 = nn.Linear(64, 10)    # 10 outputs (digits 0-9)


   def forward(self, x):
       x = x.view(-1, 784)             # flatten the image
       x = F.relu(self.fc1(x))
       x = F.relu(self.fc2(x))
       x = self.fc3(x)
       return x


model = SimpleNetwork()
print(model)
When you run the code, PyTorch prints the structure of the model:
SimpleNetwork(
  (fc1): Linear(in_features=784, out_features=128, bias=True)
  (fc2): Linear(in_features=128, out_features=64, bias=True)
  (fc3): Linear(in_features=64, out_features=10, bias=True)
)
The output shows the structure of the neural network. Each Linear layer represents a fully connected layer in the model. The first layer transforms the 784 input pixels into 128 features, the second reduces them to 64 features, and the final layer outputs 10 values representing the digit classes (0–9). This confirms that the model has been correctly defined before training begins.
Using the Jupyter console to inspect data and validate the neural network
One of the features that makes PyCharm Pro especially useful for PyTorch development is the integrated Jupyter console. It connects directly to the running notebook kernel, allowing you to inspect tensors, explore datasets, test model outputs, and debug code interactively without adding temporary cells to the notebook. This streamlines the iterative workflow and makes it easier to validate code during model development.
To access the Jupyter console, first ensure that your Jupyter notebook is running. Then click Open Jupyter Console in the notebook toolbar at the top of the editor.
Additionally, PyCharm provides a Variables view that displays all active objects in the notebook kernel, allowing quick visual inspection of shapes, values, and types, and reducing the need for repeated print statements.
Together, these tools make it easier to inspect data and validate model behavior before training.
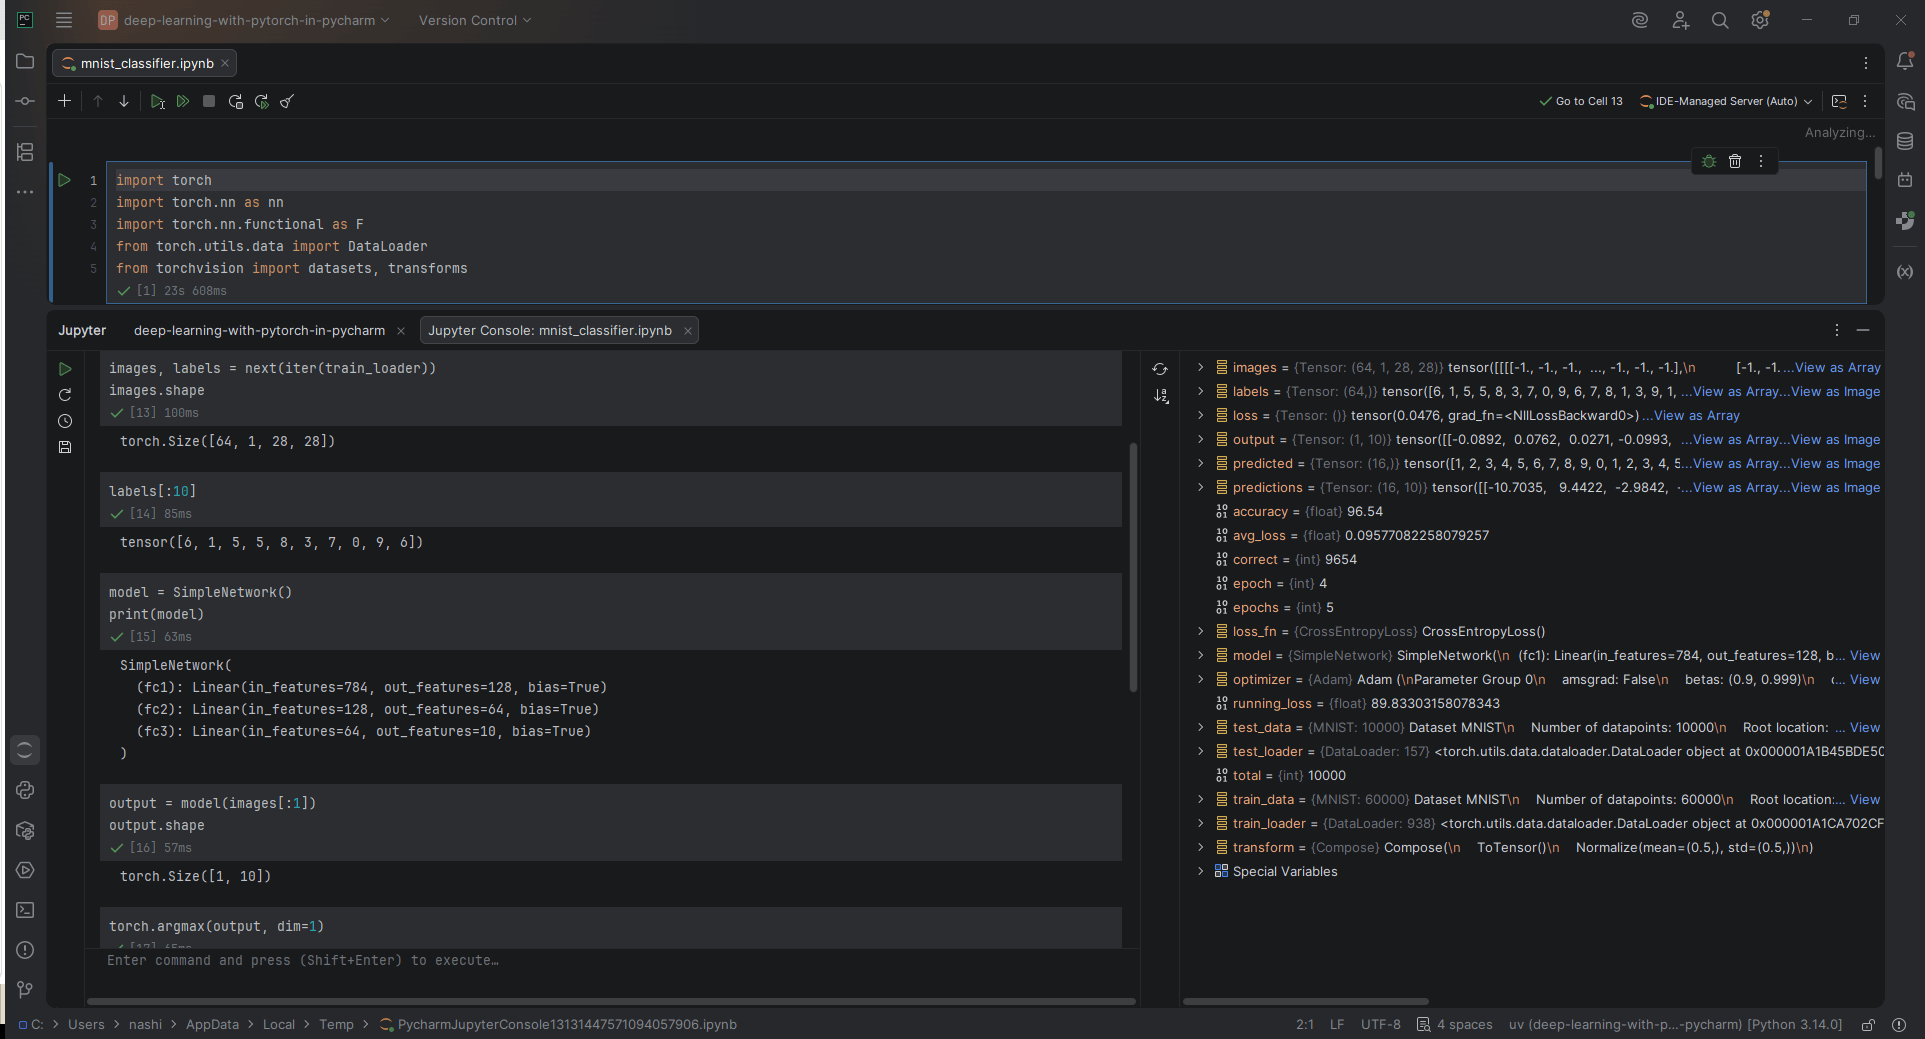 The Jupyter console allows the interactive execution of code linked to the notebook kernel, so you can inspect data and test the model before training. The Variables view displays active objects for quick inspection without print statements.
Training the model
Choosing a loss function and optimizer
Now that the model is defined, the next step is to train it so it can learn to recognize handwritten digits. During training, the model processes MNIST images, makes predictions, compares them to correct labels, and gradually improves its performance. To do this, we first need two key components: a loss function and an optimizer.
The loss function measures how far the model’s predictions are from the correct answers. In classification problems like MNIST (which has 10 classes, one for each digit), CrossEntropyLoss is used because it is designed for multi-class classification, and it not only penalizes incorrect predictions but also takes into account how confident the model is when it makes a mistake.
The optimizer is responsible for updating the model’s weights based on the loss. It determines how the model learns from its errors.
We also need to select an optimizer. Adaptive moment estimation (ADAM) and stochastic gradient descent (SGD) are two examples of these – they take the loss and adjust the model’s weights to do better next time.
The difference is how they do it. SGD updates model weights using a fixed learning rate applied to the computed gradients. ADAM extends this idea by adapting the learning rate for each parameter using estimates of past gradients, which often leads to faster and more stable convergence with less manual tuning. For this project, ADAM is the practical choice, with lr=0.001 as a safe default learning rate. SGD is worth exploring later when you want more control over the training process.
Implementing a training loop
The training loop is the core of the learning process. Each full pass through the training data is called an epoch. Training typically runs for multiple epochs so that the model can gradually improve its performance over time.
Each epoch is made up of smaller units called batches. Instead of processing the entire dataset at once, the model processes one batch at a time, which makes training more efficient and memory-friendly.
During each epoch, the model processes data in batches and repeats the same steps:
- Forward pass: The model makes predictions (logits).
- Loss computation: The model compares predictions with true labels.
- Backward pass: The model computes gradients of the loss.
- Weight update: The optimizer adjusts model parameters.
There are a few important implementation details to note when it comes to this section:
model.train()switches the model into training mode and must be called at the start of each epoch.optimizer.zero_grad()must be called beforeloss.backward()every iteration because, without it, PyTorch accumulates gradients from previous batches, which corrupts the updates. This is one of the most common beginner mistakes in PyTorch.loss.item()converts the loss tensor into a Python number for logging. This detaches it from the computation graph, ensuring it is not tracked for gradients.
The code below implements the training loop and prints the loss at the end of each epoch:
# Define loss function and optimizer
loss_fn = nn.CrossEntropyLoss()
optimizer = torch.optim.Adam(model.parameters(), lr=0.001)

# Training loop
epochs = 5

for epoch in range(epochs):
   model.train()
   running_loss = 0

   for images, labels in train_loader:
       # Forward pass
       predictions = model(images)
       loss = loss_fn(predictions, labels)

       # Backward pass
       optimizer.zero_grad()
       loss.backward()
       optimizer.step()

       running_loss += loss.item()

   avg_loss = running_loss / len(train_loader)
   print(f"Epoch {epoch+1}/5 — Loss: {avg_loss:.4f}")
The output below shows the model’s training progress over five epochs, with the loss steadily decreasing as learning improves.
Epoch 1/5 — Loss: 0.4014
Epoch 2/5 — Loss: 0.1937
Epoch 3/5 — Loss: 0.1364
Epoch 4/5 — Loss: 0.1116
Epoch 5/5 — Loss: 0.0957
Debugging the training process using the PyCharm debugger
While basic Python debugging is available in PyCharm, the PyCharm Pro subscription extends this capability by providing full support for debugging Jupyter notebooks and interactive machine learning workflows.
During model training, breakpoints can be set inside key stages of the training loop, such as the forward pass, allowing execution to pause while the notebook remains interactive. For the MNIST handwritten digit classification project developed in this tutorial, the breakpoint was placed on: predictions = model(images).
This marks the start of the forward pass, in which a batch of input images is passed through the neural network to generate predictions. Pausing execution immediately before this line makes it possible to inspect the input data before the model processes it and then examine the model’s outputs after stepping over the line. This provides a clear view of how data flows through the network during training.
In the PyCharm debugger, the Watches pane lets you monitor custom expressions whenever execution pauses at a breakpoint. Rather than repeatedly evaluating expressions manually, watches automatically refresh their values after each debugging step, making it easier to inspect tensors and verify intermediate results throughout the training process.
For this project, the following watches were added:
images.shape, to verify the dimensions of each input batch.labels.shape, to confirm that the batch of labels corresponds to the input images.predictions.shape, to verify that the network produces an output tensor of the expected shape after the forward pass.predictions.argmax(dim=1)[:5], to display the predicted digit for the first five images in the batch.
After stepping over the forward pass, these watches automatically update to display the model’s outputs. This makes it straightforward to verify that the input tensors have the expected dimensions, confirm that the network produces a prediction for each image in the batch, and inspect the predicted digit classes without modifying the source code.
The debugging workflow described in this section is demonstrated in this video:
Model evaluation
Training is done, but a low training loss does not necessarily mean your model is good. It might have simply memorized the training data. Evaluation on unseen test data tells you how well it actually generalizes. After five epochs of training, the model achieves a test accuracy of 96.87%, correctly classifying 9,687 out of 10,000 previously unseen digits.
This indicates that the model generalizes well to new data for a simple fully connected architecture without additional optimization techniques. It also demonstrates one of PyTorch’s biggest strengths in practice: You can go from raw data to a working, accurate model with relatively little code.
model.eval()
correct = 0
total = 0

with torch.no_grad():
   for images, labels in test_loader:
       predictions = model(images)
       _, predicted = torch.max(predictions, 1)
       total += labels.size(0)
       correct += (predicted == labels).sum().item()

accuracy = 100 * correct / total
print(f"Test Accuracy: {accuracy:.2f}%")
Advanced PyTorch techniques for deep learning
There are advanced PyTorch techniques that can be explored when you grasp building and training basic models. They can take your work further, for example by allowing you to train faster, scale larger, or move a model into production. Some of them include:
- GPU acceleration. One of the highest-impact changes you can make is moving your model and data to a GPU. Modern NVIDIA GPUs such as the A100, H100, and V100 are recommended to accelerate PyTorch with the greatest speedup. They offer exceptional performance, especially for features such as
torch.compile. - Distributed learning. When a single GPU is not enough – either because your model is too large or your dataset too vast – PyTorch’s
torch.distributedbackend lets you scale training across multiple GPUs or machines.DistributedDataParallel(DDP) enables distributed training across multiple GPUs or machines, significantly boosting compute power and reducing training time. When the capacity of a single GPU is exceeded by your model, DDP becomes essential and requires only a few additional lines of code to set up. - Model deployment. Training a model is just one key aspect; eventually, you need to deploy it to real users. TorchServe is a flexible and easy-to-use tool for serving Python models in production. It supports deploying models in either eager or graph mode using TorchScript, serving multiple models concurrently, versioning models for A/B testing, loading and unloading models dynamically, and monitoring detailed logs and customizable metrics.
These three techniques represent the natural progression of any advanced deep learning project. You start on a single machine, scale when needed, and ship when you are ready. They are worth exploring as your projects grow in ambition.
Summary and resources
In this tutorial, you went from understanding what PyTorch is to building and training a neural network that recognizes handwritten digits with over 96% accuracy. Also, we covered tensors, the torch.nn module, the training loop, and model evaluation, which are the core building blocks of every deep learning project built with PyTorch.
This is just the beginning. PyTorch’s real depth lies in what comes next – convolutional networks, transfer learning, and the vast Hugging Face ecosystem of pre-trained models, which run on a PyTorch backend, all built on the same foundations you learned here. Continue to experiment! Swap the optimizer, add a layer, and try a different dataset.
A great next step is to explore the official PyTorch tutorials, which cover everything from convolutional networks to deploying models in production. For a more structured learning path, the Zero to Mastery PyTorch course is free and beginner-friendly, picking up exactly where this tutorial ends.
Build your first PyTorch model in PyCharm
PyCharm gives you one environment for the full deep learning workflow: installing PyTorch, writing model code, running notebooks, debugging the training loop, inspecting tensors, tracking experiments, and managing your project with Git or Docker as it grows.
Download PyCharm for free and use this tutorial to build your first MNIST classifier.
About the author

Python Morsels
Binary search in Python with bisect
Python's bisect module implements binary search for you. Here's how bisect_left, bisect_right, and insort work, plus recipes for finding the closest match or all values in a range.
Table of contents
- Binary search explained
- Why not use a set instead of binary search?
- Binary search with the
bisectmodule - Python's
bisectfunctions explained - Binary search recipes using Python's
bisect - Binary insert with
insort - Using
bisectwith akeyfunction - Realistic examples of binary search
- Don't use binary search on an unsorted collection
- Use
bisectto search sorted sequences in Python
Binary search explained
I'm thinking of a number between 1 and 100. You have 7 guesses. After each wrong guess I'll tell you whether the number I'm thinking of is higher or lower.
What should you guess?
Here's the approach I'd use:
- Guess 50 first, splitting the possible guess pool in half (bisecting it)
- If the correct number is below 50, guess 25 (bisecting the remaining pool)
- If the correct number is above 50, guess 75 (bisecting the remaining pool)
- Repeat, splitting the possible remaining numbers in half each time
That's binary search in a nutshell.
The binary in binary search means two: every guess splits the remaining search space into two groups and rules out one of them. It has nothing to do with binary numbers or ones and zeroes. That same two is in the word bisect, which means to cut something into two pieces.
Try it below: each guess rules out every number on one side of it, and guessing the middle number every time will always find my number within 7 guesses.
.binary-search-grid { grid-template-columns: repeat(10, minmax(0, 1fr)); } @media (min-width: 640px) { .binary-search-grid { grid-template-columns: repeat(auto-fill, minmax(2.5rem, 1fr)); } }I'm thinking of a number from 1 to 100
If you'd prefer to see code, here's an example:
def binary_search(sequence, target, low=0, high=None):
    """Return the index where the target number would belong."""
    if high is None:
        high = len(sequence)
    while low < high:
        middle = (low + high) // 2
        if sequence[middle] < target:
            low = middle + 1
        else:
            high = middle
    return low
That binary_search function looks for a potential match within a sorted sequence.
Why should we care about this, though?
Why not just use a containment check with the in operator?
Well, this binary search among 10 million items does 23 comparisons:
sequence = list(range(10_000_000))
target = 2_728_839

index = binary_search(sequence, target)
if index < len(sequence) and sequence[index] == target:
    print(f"{target} found")
But this containment check of the same items does well over 2 million comparisons:
sequence = list(range(10_000_000))
target = 2_728_839

if target in sequence:
    print(f"{target} found")
You can see for yourself how much quicker binary search is.
That's the difference between O(log n) and O(n): doubling the size of our sorted list adds just one more comparison to a binary search.
Note that both of those examples above are a bit silly because those "sorted sequences" are consecutive numbers without gaps or duplicates. We'll take a look at a more realistic example below. But first, let's talk about why we can't always use a set or a dictionary instead of binary search.
Why not use a set instead of binary search?
If you're familiar with the …
Read the full article: https://www.pythonmorsels.com/binary-search/
July 28, 2026
PyCoder’s Weekly
Issue #745: PyPI UI, Finding Classes with the GC, pylock.toml, and More (2026-07-28)
#745 – JULY 28, 2026
View in Browser »

Planned Updates to the PyPI User Interface
Over the next few months a new user interface will be rolled out for the Python packaging website, PyPI. The rollout will be done in phases to make sure it is rock solid and to get community feedback. This post talks about the history of PyPI’s UI and what is changing.
NICOLE HARRIS
Find All Instances of a Class With gc.get_objects()
If you’re debugging a situation with multiple references to an object and you want to hunt down all instances, the garbage collector module can help you out.
ADAM JOHNSON
Let AI Agents Into Your B2B App. Securely
More of your users are asking to connect AI agents to your product, and you want to say yes. PropelAuth lets you give each agent scoped, revocable access, so you stay in control of what it can do. Learn More →
PROPELAUTH sponsor
Tool-Agnostic Python Lock Files With PEP 751 and pylock.toml
Learn how PEP 751 standardizes Python lock files with pylock.toml: generate one with pip or uv, install it with uv or pdm, and retire requirements.txt.
REAL PYTHON
Articles & Tutorials
A Versatile LLM Harness & Scraping the Web With Scrapy
Which is more important, the model or the “harness” around an LLM? What are ways to assemble an efficient agentic developer workflow? This week on the show, Ayan Pahwa joins us to discuss harnessing, web scraping, and self-hosting Python applications.
REAL PYTHON podcast
Pip 26.2: –only-deps Solves Years of Deployment Hacks
When working with scripts and simpler projects, sometimes you need dependencies installed without the full package. There have been work arounds for years, but now pip 26.2 has a new flag to support this.
JAMES O'CLAIRE
[Registration Closing] Claude Code for Python Developers
By Sunday evening, you’ll have built, debugged, and shipped a complete Python project with an AI agent, and you’ll know how to bring that agentic engineering workflow to your own codebase on Monday. Live on August 1–2, doors close this Friday. Claim Your Spot →
REAL PYTHON sponsor
PyPI Releases Now Reject New Files After 14 Days
“The Python Package Index (PyPI) now rejects new files being uploaded to releases that are older than 14 days. This restriction was put in place to prevent old and long-stable releases from being poisoned”
PYPI.ORG
Nifty Django Feature: Form Templates
Form templates in Django allow you to make reusable pieces for forms, giving a separation between the view’s template and how the form gets rendered.
TIM SCHILLING
FastAPI: Python API Development With Light Speed
Learn FastAPI from the ground up. Build REST APIs, serve web pages with Jinja2 templates, and create a complete URL shortener project in Python.
REAL PYTHON
Using NumPy reshape() to Change the Shape of an Array
Learn how to use NumPy reshape() in Python to change an array’s shape, add or remove dimensions, and control how the data is rearranged.
REAL PYTHON
Security: Line Goes Up
CPython is experiencing a huge increase in security reports. This post talks about why that is happening and how it is being handled.
HUGO VAN KEMENADE
What Our AI Guiding Principles Actually Mean
Wagtail’s five AI principles, from policy / guidelines to practice and how they steer responsible AI adoption for the project.
THIBAUD COLAS
Exploring Python’s Built-in Functions
Learn Python’s built-in functions for math, data types, iterables, and I/O, and when to use each to write more Pythonic code.
REAL PYTHON course
Projects & Code
interlock: Circuit Breaker On Failure Rate and Latency
GITHUB.COM/BAGOWIX • Shared by Bogdan Galushko
tsauditor: Statistical Auditor for Temporal Data Leakage
GITHUB.COM/IMANN128 • Shared by Iman Naeem
darnlink: Fix Relative Markdown Links When Files Move
GITHUB.COM/TXEMI • Shared by txemi
Events
Weekly Real Python Office Hours Q&A (Virtual)
July 29, 2026
REALPYTHON.COM
Melbourne Python Users Group, Australia
August 3, 2026
J.MP
PyBodensee Monthly Meetup
August 3, 2026
PYBODENSEE.COM
STL Python
August 6, 2026
MEETUP.COM
Canberra Python Meetup
August 6, 2026
MEETUP.COM
Sydney Python User Group (SyPy)
August 6, 2026
SYPY.ORG
PyCon Indonesia 2026
August 8 to August 10, 2026
PYCON.ID
Happy Pythoning!
This was PyCoder’s Weekly Issue #745.
View in Browser »
[ Subscribe to 🐍 PyCoder’s Weekly 💌 – Get the best Python news, articles, and tutorials delivered to your inbox once a week >> Click here to learn more ]
Python Software Foundation
Announcing a 2026 PSF Grants Program Funding Round
The Python Software Foundation (PSF) is excited to announce a 2026 PSF Grants Program funding round. This is not a full reopening of the Grants Program as it existed before. Rather, it's what the PSF is able to sustainably offer right now, given where we stand financially and operationally. The PSF Board, PSF Staff, and PSF Grants Work Group (GWG) are deeply passionate about the program and understand how important it is to the Python community. It’s our honor to have the opportunity to disburse grant funding in 2026.
In keeping with our focus on sustainability, this round of grant funding has a set budget capped at $90,000 USD, a limited scope, and a different structure and timeline for applying and reviewing. We will be accepting applications from August 4 - 25 AoE, for Conferences and Workshops that are scheduled between December 1, 2026, and April 30, 2027. Our top priority is getting available funds to the regional communities who need it most: those who have had to pause their events and initiatives because of lack of funding from PSF Grants or loss of sponsors.
Context
As folks following along with the PSF may remember, the last couple of years have been financially challenging, with the PSF’s assets and yearly revenue declining and costs increasing across the board. At the same time, the demand for our work has continued to multiply. Making the decision to pause the Grants Program last year was difficult, but a necessary step to protect both the future of the program and the short- and long-term sustainability of the PSF.
The PSF acknowledges the pause created challenging situations for the many community groups that had planned to apply for the grants program. We also recognize and appreciate the community's support—both in response to the announcement of the pause and through the outstanding results of the 2025 end-of-year fundraiser.
The Python community showed up with understanding and solidarity when the pause happened and helped us come up with ideas on how the PSF could serve the community in non-financial ways. Those ideas were the seeds that grew into the PSF Community Partner Program, a non-monetary partnership offered to qualifying applicants. This program assists Community Partners by attaching the PSF name to the event or initiative, which lends credibility, helps attract sponsors, and provides promotional support through reposts on PSF social media accounts.
Funding Round Eligibility, Caps, and Criteria
Eligibility Timeframe
The 2026 Grants Program Funding Round will be narrowly scoped to Conferences and Workshops of all types that are scheduled between December 1, 2026, and April 30, 2027. If all goes well, the PSF intends to run future rounds of funding, so please do not be discouraged if your event doesn’t fit within this time frame. This time frame reflects the PSF's current finances, our staff capacity, and our goal of getting funds to recipients while they're useful.
Categories of grants that will be considered (includes virtual):
- Conferences. One or more days of conference programming, with at least 60% Python content.
- Workshops (Python-related, PyLadies, and DjangoGirls). One or more days of workshop programming, with at least 6 hours per day of instruction.
The PSF also wants to acknowledge that this timeframe may exclude some events and initiatives that also missed out on funding in 2025. Please know exclusion is not our intent. If we are able to offer later rounds, we plan to prioritize events and initiatives that missed out on funding in 2025 and 2026 due to the timing windows. Getting the program back up and running is a lot of work for our small team, and we have experienced significant staffing changes in the last year. These changes have made it harder to keep pace with our regular activities, let alone get the Grants Program up and running again. What felt the most important was getting at least some funds out, even if we couldn’t kick the program off right at the same time of year it was paused last year.
Adjustments to Grant Category Caps
The 2026 Grants Program Funding Round will adjust the cap for Conference type grants down to $2,000 USD and maintain the Workshop type grant cap at $1,500 USD. This change reflects a focus on supporting hyper-local communities that had to halt their activities due to the PSF Grants Program pause.
The PSF has observed, through social media, Grants Program Office Hours, and informal conversations, that many large and long-standing international PyCons are still taking place without PSF Grants, while workshops and smaller regional initiatives have completely paused or slowed down significantly. Based on these observations, the PSF estimates that $1,500 will make an impact for those workshops and $2000 could help fill in some gaps in PyCon budgets. Our hope is to empower as many groups as possible with this round of funding.
Please note that the caps are the maximum amount applicants can request. If you don’t need that amount, please ask for less. The guidelines the Grants Work Group observes are generally as follows:
- Conferences: Up to $15 USD per attendee per day.
- Workshops: Up to $25 USD per student per day.
Notes on Scope, Criteria, and Communication
The PSF wants to highlight that consolidated grant types will not be considered during the 2026 Grants Funding Round. While this was a great addition for when the Grants Program was running on a rolling basis, for this limited funding round, the PSF Grants Work Group needs to look at applications on a singular level. We ask that communities that previously submitted consolidated grants submit individual applications for up to 5 conferences or workshops that are scheduled to take place during the eligibility timeframe.
All previous criteria and guidelines for the PSF Grants Program will be applied to this funding round. This post won’t go over every single piece of information required on the application, but we want to highlight a couple of things:
- If the applicant has received a grant in the past for a different event, or the event itself has received a grant, a report must be submitted via our grant reporting form. This is a hard requirement due to our status as a charity based in the US, as our grant awards must be auditable to the best of our ability. We do our best to make this as small a burden on grant recipients as possible.
- The applying event or initiative must have a Code of Conduct and reporting mechanism prominently displayed on your event’s website. Part of the PSF’s mission is to support and facilitate a diverse and international community of Python programmers, which means that it is essential for our grant recipients to have an enforceable Code of Conduct. If your event or workshop does not have a Code of Conduct or reporting mechanism, check out our event Code of Conduct best practices documentation.
- We are unable to provide grant funding for:
- Personal travel requests
- Hackathons
- T-shirts, swag, giveaways, and prizes
- Events and initiatives unrelated to Python or the PSF’s charitable mission
Grants Funding Round Schedule
Listed in the table below is the anticipated schedule for the 2026 PSF Grants Program Funding Round. The timeline is tight (applications open next week!), but our team hopes that three weeks to get applications in is reasonable and accommodates events and initiatives that fall in the eligibility timeframe.
| Date | Phase | Description |
|---|---|---|
| August 4 - 25 AoE | Application | Applications open; PSF Staff performs initial reviews as applications are received; any missing information is collected |
| August 25 - September 11 | Review | Grants Work Group review; clarifying information collected as needed; Grants Work Group votes |
| September 14 | Decision | Decisions communicated to all applicants |
| September 14 and onwards | Disbursement | Funds disbursed |
After things kick off, the PSF may need to adjust dates by a couple days here and there. This program is dependent on just a couple of staff (Hi, Marie and Laura!) and our wonderful Grants Work Group (Thank you, team!) that is composed of volunteers. If dates need to be adjusted, we will be sure to communicate that in multiple places (Emails direct to applicants, Discuss, PSF Discord, and PSF social media accounts: LinkedIn, Mastodon, Bluesky, X).
The PSF asks that applicants closely monitor their emails from the point they submit their application to the end of the review phase. We would be disappointed to see events and initiatives miss out on grant funding due to gaps in their application. The more responsive applicants can be, the better!
How to Apply
Submit your applications via the PSF Grants Program application form. Before August 4 and after August 25, the form is still available but only taking applications for the PSF’s Meetup Pro Network.
Questions or feedback?
Phew—that was a lot of information! The PSF expects questions about the 2026 Grants Program Funding Round. In fact, there may be things we’ve overlooked, and we would appreciate you sharing anything you think we’re missing. Your feedback will help us improve during the process and for future rounds. There are multiple ways for you to reach out to us with your questions, feedback, and comments:
- Discuss forum thread
- Email grants@python.org
- PSF Grants Office Hour sessions (more info below)
Due to the accelerated nature of this grants funding round, we are holding supplemental PSF Grants Program Office Hours on the PSF Discord:
- August 4 at 1 PM UTC
- August 13 at 8 PM UTC
- August 18 at 1 PM UTC (this is our regular day/time!)
Check out what times these are for you using this timezone converter. We welcome you to join us to ask your questions, discuss the process, suggest ideas for future rounds, or anything else related to the PSF Grants Program.
Final Thoughts and Thanks
This is a big change for the PSF Grants Program. It’s moved from a rolling basis, to a pause, and now to a limited window to receive, review, and make decisions about applications. Will the process be perfectly smooth? Probably not. But we are committed to doing it as efficiently as possible, keeping the community and applicants informed of any changes, and when possible, integrating feedback we receive throughout the process.
The PSF also wants to thank you, the Python community, for your understanding and generous backing, in actions, words, and donations. We could not fulfill our mission without the community’s support and without each individual out there championing the PSF’s work. The PSF is so very grateful to be in community with each and every one of you.
About the Python Software Foundation
The Python Software Foundation is a US non-profit whose mission is to promote, protect, and advance the Python programming language, and to support and facilitate the growth of a diverse and international community of Python programmers. The PSF supports the Python community using corporate sponsorships, grants, and donations. Are you interested in sponsoring or donating to the PSF so we can continue supporting Python and its community? Check out our sponsorship program, donate directly, or contact our team at sponsors@python.org
Python Bytes
#490 It’s a vibe coding party
<strong>Topics covered in this episode:</strong><br> <ul> <li><strong><a href="https://jvns.ca/blog/2026/07/21/more-nice-django-things/?featured_on=pythonbytes">Some more things about Django I've been enjoying</a></strong></li> <li><strong><a href="https://www.ft.com/content/cec8df9e-b43b-4cd1-8feb-c07e804e8d33?featured_on=pythonbytes">Who cleans up after the vibe-coding party</a>?</strong></li> <li><strong>Where Did All Your AI Tokens Go? <a href="https://github.com/kenn-io/agentsview?featured_on=pythonbytes">AgentsView</a> to the rescue!</strong></li> <li><strong>Careful with phishing all</strong></li> <li><strong>Extras</strong></li> <li><strong>Joke</strong></li> </ul><a href='https://www.youtube.com/watch?v=fVWWd7zvcTg' style='font-weight: bold;'data-umami-event="Livestream-Past" data-umami-event-episode="490">Watch on YouTube</a><br> <p><strong>About the show</strong></p> <p>Sponsored by us! Support our work through:</p> <ul> <li>Our <a href="https://training.talkpython.fm/?featured_on=pythonbytes"><strong>courses at Talk Python</strong></a></li> <li>Consulting from <a href="https://sixfeetup.com/?featured_on=pythonbytes"><strong>Six Feet Up</strong></a></li> </ul> <p><strong>Connect with the hosts</strong></p> <ul> <li>Michael: <a href="https://fosstodon.org/@mkennedy">Mastodon</a> / <a href="https://bsky.app/profile/mkennedy.codes?featured_on=pythonbytes">BlueSky</a> / <a href="https://x.com/mkennedy?featured_on=pythonbytes">X</a> / <a href="https://www.linkedin.com/in/mkennedy/?featured_on=pythonbytes">LinkedIn</a></li> <li>Calvin: <a href="https://sixfeetup.social/@calvin?featured_on=pythonbytes">Mastodon</a> / <a href="https://bsky.app/profile/calvinhp.com?featured_on=pythonbytes">BlueSky</a> / <a href="https://x.com/calvinhp?featured_on=pythonbytes">X</a> / <a href="https://www.linkedin.com/in/calvinhp/?featured_on=pythonbytes">LinkedIn</a></li> <li>Show: <a href="https://fosstodon.org/@pythonbytes">Mastodon</a> / <a href="https://bsky.app/profile/pythonbytes.fm">BlueSky</a> / <a href="https://x.com/PythonBytes?featured_on=pythonbytes">X</a></li> </ul> <p>Join us on YouTube at <a href="https://pythonbytes.fm/stream/live"><strong>pythonbytes.fm/live</strong></a> to be part of the audience. Usually <strong>Tuesday at 7am PT</strong>. Older video versions available there too.</p> <p>Finally, if you want an artisanal, hand-crafted digest of every week of the show notes in email form? Add your name and email to <a href="https://pythonbytes.fm/friends-of-the-show">our friends of the show list</a>, we'll never share it.</p> <p><strong>Calvin #1: <a href="https://jvns.ca/blog/2026/07/21/more-nice-django-things/?featured_on=pythonbytes">Some more things about Django I've been enjoying</a></strong></p> <ul> <li><strong>Julia Evans</strong> is learning "2010-style" web dev (Django + SQL + server-rendered HTML) after years of Go backends and JS-heavy frontends</li> <li><strong>Query builders</strong>: likes defining custom QuerySet classes with chainable filter methods (<code>.approved().future().with_tags()</code>) — more readable than raw SQL</li> <li><strong>Template filters</strong>: highlights <code>urlize</code>, <code>linebreaksbr</code>, <code>json_script</code>, and especially <code>querystring</code> for building/modifying query-string links in templates</li> <li><strong>Migrations</strong>: still loves Django's auto-generated migrations — 19 and counting on her project</li> <li><strong>Skips inheritance</strong> for class-based views; prefers function-based views for sharing code, though fine using Django's own mixins/interfaces</li> <li><strong>Performance surprise</strong>: CPU profiling (via <code>py-spy</code>) — not slow DB queries — revealed the culprit; she'd accidentally disabled the cached template loader, and re-enabling it took throughput from ~2-3 req/s to ~12 req/s on a $10/mo VM</li> </ul> <p><strong>Michael #2: <a href="https://www.ft.com/content/cec8df9e-b43b-4cd1-8feb-c07e804e8d33?featured_on=pythonbytes">Who cleans up after the vibe-coding party</a>?</strong></p> <p>FT Magazine piece by Sam Learner (July 11) on AI coding tools overwhelming open source maintainers - sent in by listener Dylan McConnell, whose main point was that this ran in the <em>Financial Times</em>, not a dev blog.</p> <ul> <li><strong>cURL as the case study</strong> - Daniel Stenberg has been the only full-time person on it for years; libcurl has been installed an estimated 20+ billion times with 3,000+ listed contributors.</li> <li><strong>Bug bounty killed</strong> - cURL ended its paid security bounty program in January, citing an "explosion of AI slop reports" that take real time to debunk and drain morale.</li> <li><strong>Extractive contributions</strong> - authoring a PR is now nearly free, reviewing one still costs a human; tldraw's Steve Ruiz closed outside contributions entirely, asking why he'd want someone else writing the easy part.</li> <li><strong>Guido weighs in</strong> - van Rossum says projects are holding emergency meetings over the slop flow, and notes LLM patches tend to touch unrelated parts of a file, making review more tedious.</li> <li><strong>"Vibe Coding Kills Open Source"</strong> - paper from Miklós Koren's group: packages frequently recommended by coding models saw big download jumps with no matching engagement, breaking the reputation loop that sustains maintainers.</li> <li><strong>Stack Overflow flatlined</strong> - over 100,000 questions a month before ChatGPT, under 1,500 last month, with the response rate cut roughly in half; the public archive is now stale training data.</li> <li><strong>The course-creator angle</strong> - Josh Comeau's newest web dev course launched at about a third of prior enrollment, and he worries about devs who never learn which questions to ask.</li> </ul> <p>But <strong>the most interesting portion is what was omitted</strong>.</p> <ul> <li>Focused on: <a href="https://daniel.haxx.se/blog/2026/01/26/the-end-of-the-curl-bug-bounty/?featured_on=pythonbytes">The end of the curl bug-bounty</a></li> <li>Omitted: <a href="https://daniel.haxx.se/blog/2026/04/22/high-quality-chaos/?featured_on=pythonbytes">High-Quality Chaos</a></li> </ul> <p><strong>Why the omission is interesting</strong></p> <ul> <li>It fits a narrative. The FT piece is a maintenance-and-decline story, and January-Stenberg is a perfect witness for it. April-Stenberg complicates it - same person, same project, better data, opposite direction on the specific claim being used.</li> <li>The tell is already in the article. Learner quotes Stenberg saying AI tools are much better at finding problems than fixing them. That's the April thesis in one line, and it goes undeveloped.</li> <li>Reason for the shift is process, not vibes. Killing the bounty removed the cash incentive and the venue change filtered the rest. Worth saying out loud, because "AI reports got better" isn't quite it - "no bounty plus a real triage platform" is closer.</li> </ul> <p>Joke too: Sarah O’Connor <a href="https://blobs.pythonbytes.fm/recommended-on-ai-coding-takovers.jpeg?cache_id=0a8041">wrote a related piece</a> (is this just before skynet launches?)</p> <p><strong>Calvin #3: Where Did All Your AI Tokens Go? <a href="https://github.com/kenn-io/agentsview?featured_on=pythonbytes">AgentsView</a> to the rescue!</strong></p> <ul> <li>Local-first desktop/web app for browsing, searching, and analyzing your past AI coding agent sessions (Claude Code, Codex, Copilot, Cursor, Gemini, Aider, and dozens more)</li> <li>Auto-discovers session files on your machine — no config needed; everything stored locally in SQLite, no cloud/accounts</li> <li><code>agentsview usage</code> is a drop-in <code>ccusage</code> alternative — reads from pre-indexed SQLite, reports run 80–220× faster on large histories</li> <li>New <strong>Activity</strong> dashboard shows peak concurrency, active vs. idle time, agent-minutes, and cost — filterable by project/agent/machine, with a <code>-json</code> CLI report too</li> <li>Full-text + optional semantic search across every session; also imports <a href="http://Claude.ai/ChatGPT?featured_on=pythonbytes">Claude.ai/ChatGPT</a> chat exports</li> <li>Install via <code>pip install agentsview</code>, <code>uvx agentsview</code>, <code>brew install --cask agentsview</code>, or download desktop binaries from GitHub Releases</li> </ul> <p><strong>Michael #4: Careful with phishing all</strong></p> <p><strong>The situation</strong></p> <p>I pass this along because it was a pretty sneaky bit of targeted phishing, and happened to play off an old interaction in bandit's repo. As usual with phishing scams there are a bunch of tells that this isn't legitimate, but just enough plausibility that I could see falling for it in a weak moment. Relative nobodies like me haven't historically been worth the effort to hit with scams this specific. Agents change the game though :-/. Be careful out there folks!</p> <p><strong>Original message</strong></p> <p>From: "Patrick (Blacktrace)" [HTML_REMOVED] To: LISTENER EMAIL Subject: Your Bandit #1350 (B105 NextToken false positive) -- just fixed that exact case</p> <p>Date: Wednesday, July 15, 2026 12:02 AM</p> <p>Hi AJ,</p> <p>Saw your Bandit issue #1350 -- the B105 hardcoded-password false positive on the string NextToken. I build a deterministic gate that filters that class of Bandit noise, and #1350 was literally the case I just fixed: NextToken / next_token / page_token / nextPageToken now stay quiet, while a genuine hardcoded token like api_token="sk-live-..." still fires. Verified against your exact case.</p> <p>30-second paste: https://blacktrace.co/noise-eraser</p> <p>Where it still trips, published: https://blacktrace.co/kruc</p> <p>Curious whether it clears what you hit -- and if it trips on something of yours, that's the more useful reply.</p> <ul> <li>Patrick, Blacktrace</li> </ul> <hr /> <p>I asked Claude for some analysis too. It was pretty good at finding them.</p> <p>The message name-drops enough real detail to feel legit, but the structure is pure phishing - everything in it exists to get AJ onto <a href="http://blacktrace.co?featured_on=pythonbytes">blacktrace.co</a>. The strongest ones:</p> <ul> <li><strong>Freemail sender, corporate signoff.</strong> Signs as "Patrick, Blacktrace" but sends from <a href="mailto:emailpjv@gmail.com">emailpjv@gmail.com</a>. Real company outreach comes from the company domain, not a personal Gmail - and there's no last name.</li> <li><strong>Over-specific targeting.</strong> It mirrors AJ's exact public activity - issue #1350, the B105 rule, the NextToken false positive, even the token variants. That's the "just enough plausibility" AJ flagged, and it's exactly what agents make cheap: scrape a GitHub issue, auto-generate tailored bait. Legit cold outreach rarely reads your history back to you this precisely.</li> <li><strong>The entire payload is two links.</strong> Strip the technical flattery and the message is just "paste here" plus "see results here." When the whole point of an email is the click, that's the tell.</li> <li><strong>"30-second paste."</strong> Low-friction urgency, and "paste" most likely means paste your source into their tool - handing your code to a stranger's site. Exfiltration dressed as convenience.</li> <li><strong>Brand-new, no-reputation domain.</strong> <a href="http://blacktrace.co?featured_on=pythonbytes">blacktrace.co</a> has no track record, and the name is doing some ominous work. The <code>/kruc</code> slug is random noise, not how real product pages get named.</li> <li><strong>Precise-sounding jargon that's actually vague.</strong> "Deterministic gate," "noise-eraser" - impressive, empty. Bolted onto correct real details (B105 is the Bandit hardcoded-password test, <code>sk-live-</code> is a Stripe live-key prefix) to borrow credibility.</li> <li><strong>The disarming close.</strong> "if it trips on something of yours, that's the more useful reply" - engineered humility that flatters your expertise and baits a response. Makes engaging feel like you're doing <em>them</em> a favor, which drops your guard.</li> </ul> <p><strong>Extras</strong></p> <p>Calvin:</p> <ul> <li><a href="https://2026.djangocon.us/?featured_on=pythonbytes">DjangoCon US 2026</a> is rapidly approaching, <strong>August 24-28, Chicago</strong></li> <li><strong>Ruff v0.16.0 massively expands its default rule set</strong> <ul> <li>Ruff now enables 413 rules by default, up from 59</li> <li>https://astral.sh/blog/ruff-v0.16.0</li> </ul></li> </ul> <p>Michael:</p> <ul> <li>Completely <a href="https://pythonbytes.fm">redesigned the home page</a>.</li> <li>Try /insights in Claude Code (terminal)</li> </ul> <p><strong>Joke:</strong> <a href="https://x.com/pr0grammerhum0r/status/2013325616951517233?s=46&featured_on=pythonbytes">We’re Safe</a></p>
July 27, 2026
Python Morsels
Running subprocesses in Python
You can use Python's subprocess.run function to launch other programs from within Python.

Table of contents
- Launching external programs from Python
- Subprocess, defined
- Launch a subprocess with
subprocess.run - Using
subprocess.runwith a list or a string - Capturing the output of a subprocess
- Automatically decoding subprocess output
- Handling errors in subprocesses
- Raising exceptions based on subprocess exit codes
- Helper functions for
subprocess.run - Launch subprocesses with
subprocess.run
Launching external programs from Python
We're going to focus on starting up other processes (that may not be Python processes), communicating with those processes, and handling their output.
We're not talking about the related topics of concurrency and parallelism.
For those, you can use Python's threading, multiprocessing, or concurrent.futures modules.
We're specifically going to focus on spawning subprocesses.
For this we will use Python's subprocess module.
Subprocess, defined
A subprocess is a process …
Read the full article: https://www.pythonmorsels.com/running-subprocesses-in-python/
Python Software Foundation
Announcing Python Software Foundation Fellow Members for Q2 2026! 🎉
The PSF is pleased to announce its second batch of PSF Fellows for 2026. Let us welcome the new PSF Fellows for Q2! The following people continue to do amazing things for the Python community:
Andy Terrel
Julius Nana Acheampong Boakye
Petr Viktorin
Sayantika Banik
Takanori Suzuki
GitHub, Website, LinkedIn, X, Untappd
Thank you for your continued contributions. We have added you to our Fellows Roster.
The above members help support the Python ecosystem by being phenomenal leaders, sustaining the growth of the Python scientific community, maintaining virtual Python communities, maintaining Python libraries, creating educational material, organizing Python events and conferences, starting Python communities in local regions, and overall being great mentors in our community. Each of them continues to help make Python more accessible around the world. To learn more about the new Fellow members, check out their links above.
Let's continue recognizing Pythonistas all over the world for their impact on our community. The criteria for Fellow members is available on our PSF Fellow Membership page. If you would like to nominate someone to be a PSF Fellow, please send a description of their Python accomplishments and their email address to psf-fellow at python.org. We are accepting nominations for Quarter 3 of 2026 through August 20th, 2026.
Are you a PSF Fellow and want to help the Work Group review nominations? Contact us at psf-fellow at python.org.
July 26, 2026
Talk Python to Me
#556: Updates on Django's Async Story
For years, "Django and async" came with an asterisk. The docs themselves warned you off it. Scary performance notes, a story that felt half-finished. Well, that story just got rewritten, literally, and the person who rewrote it is here to tell you why the old framing was wrong. <br/> <br/> Carlton Gibson is a former Django Fellow, sat on the security team for eight years, and he's on the steering council. On this episode we get into the async topic doc rewrite, what actually remains versus what was just fear, the new Tasks framework in 6.0, DB-level cascades and fetch modes landing in 6.1, and why free-threading is the bet that's about to pay off big for Django. If you've been told Django's async story isn't ready, this is the episode that puts that myth to bed.<br/> <br/> <strong>Episode sponsors</strong><br/> <br/> <a href='https://talkpython.fm/sentry'>Sentry Error Monitoring, Code talkpython26</a><br> <a href='https://talkpython.fm/devopsbook'>Python in Production</a><br> <a href='https://talkpython.fm/training'>Talk Python Courses</a><br/> <br/> <h2 class="links-heading mb-4">Links from the show</h2> <div><strong>DjangoCon Europe</strong>: <a href="https://djangocon.eu/?featured_on=talkpython" target="_blank" >djangocon.eu</a><br/> <strong>PyCon Italia</strong>: <a href="https://pycon.it/?featured_on=talkpython" target="_blank" >pycon.it</a><br/> <strong>Django on the Med</strong>: <a href="https://djangomed.eu/?featured_on=talkpython" target="_blank" >djangomed.eu</a><br/> <strong>Django Mantle</strong>: <a href="https://noumenal.es/mantle/?featured_on=talkpython" target="_blank" >noumenal.es</a><br/> <strong>PyPI</strong>: <a href="https://pypi.org/project/django-mantle/?featured_on=talkpython" target="_blank" >pypi.org</a><br/> <strong>release notes</strong>: <a href="https://docs.djangoproject.com/en/6.1/releases/6.1/?featured_on=talkpython" target="_blank" >docs.djangoproject.com</a><br/> <strong>on_delete</strong>: <a href="https://docs.djangoproject.com/en/6.1/ref/models/fields/#django.db.models.ForeignKey.on_delete" target="_blank" >docs.djangoproject.com</a><br/> <strong>Fetch modes</strong>: <a href="https://docs.djangoproject.com/en/6.1/topics/db/fetch-modes/?featured_on=talkpython" target="_blank" >docs.djangoproject.com</a><br/> <strong>HttpRequest.multipart_parser_class</strong>: <a href="https://docs.djangoproject.com/en/6.1/ref/request-response/?featured_on=talkpython" target="_blank" >docs.djangoproject.com</a><br/> <strong>async topic doc</strong>: <a href="https://docs.djangoproject.com/en/dev/topics/async/?featured_on=talkpython" target="_blank" >docs.djangoproject.com</a><br/> <strong>docs</strong>: <a href="https://docs.djangoproject.com/en/6.0/topics/tasks/?featured_on=talkpython" target="_blank" >docs.djangoproject.com</a><br/> <strong>DEP 14</strong>: <a href="https://github.com/django/deps/blob/main/final/0014-background-workers.rst?featured_on=talkpython" target="_blank" >github.com</a><br/> <strong>django-tasks</strong>: <a href="https://github.com/RealOrangeOne/django-tasks?featured_on=talkpython" target="_blank" >github.com</a><br/> <strong>django-tasks-local</strong>: <a href="https://github.com/lincolnloop/django-tasks-local?featured_on=talkpython" target="_blank" >github.com</a><br/> <strong>Celery</strong>: <a href="https://docs.celeryq.dev/?featured_on=talkpython" target="_blank" >docs.celeryq.dev</a><br/> <strong>PEP 703</strong>: <a href="https://peps.python.org/pep-0703/?featured_on=talkpython" target="_blank" >peps.python.org</a><br/> <strong>free-threading HOWTO</strong>: <a href="https://docs.python.org/3/howto/free-threading-python.html?featured_on=talkpython" target="_blank" >docs.python.org</a><br/> <strong>PEP 779</strong>: <a href="https://peps.python.org/pep-0779/?featured_on=talkpython" target="_blank" >peps.python.org</a><br/> <strong>ASGI</strong>: <a href="https://docs.djangoproject.com/en/6.1/howto/deployment/asgi/?featured_on=talkpython" target="_blank" >docs.djangoproject.com</a><br/> <strong>PGBouncer</strong>: <a href="https://www.pgbouncer.org/?featured_on=talkpython" target="_blank" >www.pgbouncer.org</a><br/> <strong>Channels</strong>: <a href="https://channels.readthedocs.io/?featured_on=talkpython" target="_blank" >channels.readthedocs.io</a><br/> <strong>sync_to_async / async_to_sync</strong>: <a href="https://docs.djangoproject.com/en/6.1/topics/async/#async-adapter-functions" target="_blank" >docs.djangoproject.com</a><br/> <strong>noumenal.es</strong>: <a href="https://noumenal.es/?featured_on=talkpython" target="_blank" >noumenal.es</a><br/> <strong>Django Chat</strong>: <a href="https://djangochat.com/?featured_on=talkpython" target="_blank" >djangochat.com</a><br/> <strong>@carlton@fosstodon.org</strong>: <a href="https://fosstodon.org/@carlton" target="_blank" >fosstodon.org</a><br/> <strong>Article: Cutting Python Web App Memory Over 31%</strong>: <a href="https://mkennedy.codes/posts/cutting-python-web-app-memory-over-31-percent/?featured_on=talkpython" target="_blank" >mkennedy.codes</a><br/> <br/> <strong>Watch this episode on YouTube</strong>: <a href="https://www.youtube.com/watch?v=J1WXYE1Wjzo" target="_blank" >youtube.com</a><br/> <strong>Episode #556 deep-dive</strong>: <a href="https://talkpython.fm/episodes/show/556/updates-on-djangos-async-story#takeaways-anchor" target="_blank" >talkpython.fm/556</a><br/> <strong>Episode transcripts</strong>: <a href="https://talkpython.fm/episodes/transcript/556/updates-on-djangos-async-story" target="_blank" >talkpython.fm</a><br/> <br/> <strong>Theme Song: Developer Rap</strong><br/> <strong>🥁 Served in a Flask 🎸</strong>: <a href="https://talkpython.fm/flasksong" target="_blank" >talkpython.fm/flasksong</a><br/> <br/> <strong>---== Don't be a stranger ==---</strong><br/> <strong>YouTube</strong>: <a href="https://talkpython.fm/youtube" target="_blank" ><i class="fa-brands fa-youtube"></i> youtube.com/@talkpython</a><br/> <br/> <strong>Bluesky</strong>: <a href="https://bsky.app/profile/talkpython.fm" target="_blank" >@talkpython.fm</a><br/> <strong>Mastodon</strong>: <a href="https://fosstodon.org/web/@talkpython" target="_blank" ><i class="fa-brands fa-mastodon"></i> @talkpython@fosstodon.org</a><br/> <strong>X.com</strong>: <a href="https://x.com/talkpython" target="_blank" ><i class="fa-brands fa-twitter"></i> @talkpython</a><br/> <br/> <strong>Michael on Bluesky</strong>: <a href="https://bsky.app/profile/mkennedy.codes?featured_on=talkpython" target="_blank" >@mkennedy.codes</a><br/> <strong>Michael on Mastodon</strong>: <a href="https://fosstodon.org/web/@mkennedy" target="_blank" ><i class="fa-brands fa-mastodon"></i> @mkennedy@fosstodon.org</a><br/> <strong>Michael on X.com</strong>: <a href="https://x.com/mkennedy?featured_on=talkpython" target="_blank" ><i class="fa-brands fa-twitter"></i> @mkennedy</a><br/></div>
Ned Batchelder
Acidica
My latest fun project is a BASIC interpreter called Acidica. Classic BASIC is an old-school language first developed in 1964 that saw an explosion of implementations on microcomputers in the ‘70s and ‘80s. It’s much more primitive than the Visual Basic that you might be familiar with.
A simple BASIC program:
10 INPUT "What is your name"; U$

20 PRINT "Hello "; U$

30 INPUT "How many stars do you want"; N

40 S$ = ""

50 FOR I = 1 TO N

60 S$ = S$ + "*"

70 NEXT I

80 PRINT S$

90 INPUT "Do you want more stars"; A$

100 IF LEN(A$) = 0 THEN 90

110 A$ = LEFT$(A$, 1)

120 IF A$ = "Y" OR A$ = "y" THEN 30

130 PRINT "Goodbye ";U$

140 END
Run it, and you get this:
What is your name? Ned

Hello Ned

How many stars do you want? 10

**********

Do you want more stars? y

How many stars do you want? 20

********************

Do you want more stars? n

Goodbye Ned
The wide variety of BASIC flavors meant I first had to decide what to implement. I found Vintage BASIC and used its spec, both because it is concisely described, and because it has an implementation I could run to double-check behavior when I had questions. The site also has a collection of runnable games from Creative Computing magazine, which I remember fondly.
This was a perfect vacation-week project. It has no real-world consequences. It had some interesting problems to puzzle through. It was testable. It satisfied some nostalgia for my earlier computing days. It was bounded enough to be “done”.
In those ways, it’s very similar to a vacation project of mine from four years ago: Stilted, an implementation of PostScript.
Acidica is not useful for writing new programs, only because BASIC itself is so difficult. There is no scoping beyond single-line functions, variables names can be as long as you want but only the first two letters and first digit are significant. Keywords are recognized anywhere, so FACTOR can’t be variable name because it has TO in the middle. The only control structures are FOR, IF, and GOTO. It’s something of a testament to human persistence that programs like three-dimensional tic-tac-toe can be written in it.
As a side project, I could choose my development style: no real type checking (partly because BASIC’s values would be awkward to squeeze into static typing), and very few docstrings. There are lots of tests, but only integration tests: every test is a BASIC program to run, with a check for the correct output and/or the expected error.
To be honest, the “only integration tests” approach was kind of a pain, but I stuck with it and resisted the temptation to add unit tests along the way.
Another choice I made: no AI. I like writing programs. I get a deeper sense of the thing I am building when I have my fingers in the clay. Since there was no deadline, or even any reason to ever finish the project, I could take my time and not be rushed.
But I like the result. I enjoyed the time I spent working on it. I liked being able to stop and devote pure thinking time while doing other things when I got to the next hurdle. The next steps here might be to use this project as a test bed for some development ideas. Or maybe add a BASIC-to-Python transpiler. Or maybe it’s done.
EuroPython Society
EuroPython 2026 Code of Conduct Transparency Report
The 2026 edition of the EuroPython conference took place both online and in person in July 2026. This was the fourth conference under our current Code of Conduct (CoC), and we had Code of Conduct working group members continuously available both online and in person.
Reports
Over the course of the conference, the Code of Conduct team was made aware of the following issues:
- The program team received an anonymous email regarding the past behaviour of one of the speakers. The CoC team was consulted. However, due to the lack of verifiable details from the report, the organising team decided to not take particular action and keep an eye on the behavior of this reported speaker during the event. No further reports were received regarding this speaker during the conference.
- The CoC team received a report from an attendee regarding information shown in a talk with a map representing a disputed border. It involved showing a map of an area with dispute. The speaker was approached and agreed to add a footnote providing more information about the dispute, and the organisers were advised to add the footnote in the talk recording in post production.
- The CoC team received a report regarding certain behaviour during the Q&A session of one talk. One of the audience members interrupted the Q&A session. Although the CoC team does not find evidence suggesting violation of our current Code of Conduct, the team agreed that this behaviour should not be tolerated. The CoC team advises the conference organisers to make reminders to attendees about proper behavior during Q&A sessions. Such reminders have been made at the beginning of the third day of the conference both via email and onstage. The CoC team agreed that clearer expectations for Q&A etiquette would benefit future events.
- The CoC team received a report regarding non-consensual pictures being taken of one of the attendees. The CoC team approached the reported person, they apologized and have deleted such pictures on the spot with the present of the CoC team members.
We thank everyone who reported concerns during the conference.
July 24, 2026
Peter Bengtsson
Claude Opus is 10x faster than OpenAI GPT 5 at non-streaming completions
Claude is much faster than OpenAI gpt-5 and also faster than gpt-5-mini
Django Weblog
See You in Chicago in One Month!
In just one month, developers, maintainers, educators, and Django enthusiasts from around the world will gather in Chicago for DjangoCon US 2026.
DjangoCon US is more than a conference, it's a place to learn from the community, share ideas, contribute to Django, and make connections that last long after the event ends. Whether you're attending your first DjangoCon US or you've been coming for years, we're excited to welcome you.
Over five days, attendees will have the opportunity to:
- Learn from expert speakers and community members
- Participate in hands-on tutorials
- Collaborate during Django sprints
- Join Open Spaces and informal discussions
- Meet fellow Django developers from across the globe
If you're planning to join us, tickets are still available, and there's still time to reserve your stay at the conference hotel. The hotel room block deadline is August 3, so be sure to book your room before then.
August 24–28, 2026
Chicago, Illinois
We can't wait to see you in Chicago!
Armin Ronacher
Codeberg Divides
Codeberg recently changed its terms to exclude projects that are largely written with generative AI. Since I want GitHub to face competition I have thoughts.
Codeberg is entirely within its rights to do this. It is an association with members and a democratic process, and that process produced a result. But democracy is a way of making a decision, not a guarantee that the decision is inclusive, wise, or even good for the people already depending on it. A majority can still decide that certain projects and people no longer belong.
GitHub’s governance has never been democratic and there is plenty about the platform that I dislike. Yet democracy is not the main property I need from infrastructure. I need it to be predictable, dependable, and reasonably neutral towards the legal Open Source software hosted on it. A democratic provider without a clear constitution can be worse at those things than a corporation.
The actual wording makes this more difficult. The terms prohibit projects that mostly consist of code written by generative AI tools. In an actively developed codebase, what does “mostly” mean, and who can still tell? I could not reliably assign authorship percentages to many of my own recent projects. The line is open to interpretation precisely where it needs to be enforceable. In practice the center will probably lose out, as it has a bias.
A harsher line would probably be preferable. If Codeberg wants no LLM involvement, it should say so. If it wants to prevent autonomous repository spam and abusive resource consumption, it should write rules for those instead. The current middle ground delegates too much of the policy to moderators and community norms. I’m currently assuming the community around it draws a much harsher social boundary, making projects and maintainers unwelcome even when they technically comply.
It is a real shame that the Open Source and Free Software communities are splitting this deeply over LLMs and agents. There are serious questions about copyright, labor, energy use, slop, and maintainers drowning in generated contributions. But these tools are also becoming part of how software is made. The Open Source world needs to figure out how to engage with that future, not just divide into camps. More importantly, LLMs if done and used well, should be welcome to all of us. They could be used to reclaim control and power, away from large corporations and institutions.
As I mentioned before, I want GitHub to face true competition in the Open Source space. I would particularly like some of it to come from associations rather than another large corporation. As a European project, Codeberg naturally matters to me even more. It can choose to be a smaller community with a stronger political identity, but that is a different ambition from being a broad and dependable European alternative to GitHub.
I wish Codeberg were more forward-looking here: willing to host the Open Source software of tomorrow, not only software made in the ways its community approves of today. It has every right to make the choice it made, but I just do not think it is a good one.