

Planet Python
Last update: October 26, 2026 07:48 PM UTC
October 26, 2026
HoloViz
Lumen 1.4.0 Release
Rodrigo Girão Serrão
TypedDict with extra items

Learn how to define a TypedDict that accepts extra items of a given type.
A TypedDict is a type constructor that allows creating specialised types for dictionaries that have a fixed set of string keys:
from typing import TypedDict

class Movie(TypedDict):
    title: str
    year: int
The snippet above creates a new type Movie that represents dictionaries with the key "title" and a string value, and the key "year" and an integer value:
forrest_gump = {"title": "Forrest Gump", "year": 1994}In Python 3.15, TypedDict was improved to allow specifying whether or not the dictionary may have other keys and what must be the type of those other items when they're allowed.
15 days of Python 3.15
To celebrate the release of Python 3.15, over the next 15 business days I'll be writing about a new 3.15 feature every day. Explained clearly and with examples so you don't have to sift through the changelog.
Subscribe to receive this free email series:
If you want, you can also check the schedule of the upcoming emails.
Allowing extra items of a given type
When creating a TypedDict, you may specify the class parameter extra_items.
When extra_items is set, your TypedDict may have additional keys of the type specified:
from typing import TypedDict

class Movie(TypedDict, extra_items=str):
    title: str
    year: int
This snippet of code creates a TypedDict with two keys that allows extra string items, as specified by extra_items=str:
# ✅ Type checks
m1: Movie = {"title": "Forrest Gump", "year": 1994, "genre": "Comedy/Romance"}
The assignment to m1 is type safe.
While the key "genre" is not specified in the definition of Movie, the corresponding item is a...
The Python Coding Stack
A New Price Without Breaking the Old One • The O in SOLID
The potion shop has a special price for apprentices. They receive ten per cent off a potion’s full price, including any rare-ingredient surcharge.
We’ve visited this shop before. In The Potion Shop That Does Too Much • The S in SOLID, its PotionShop class handled several jobs, from checking stock and recording sales to sending messages by owl. But you don’t need the code in that article to follow along in this one.
This time, we’ll stay at the same shop and focus on one part of its work: pricing. Before adding anything new, let’s look at the apprentice rule the shop already has.
For a potion with a base price of £100 and a £20 surcharge, the calculation is:
£100 + £20 = £120
10% off £120 = £108
Let’s look at how this is implemented.
Start with the Apprentice Price
The shop’s PotionPricing class knows how to calculate the apprentice price. Its .price() method accepts a customer type because that is part of each quote. But apprentices are the only special-price customers the shop supports so far.
You can follow along by putting this code in pricing.py:
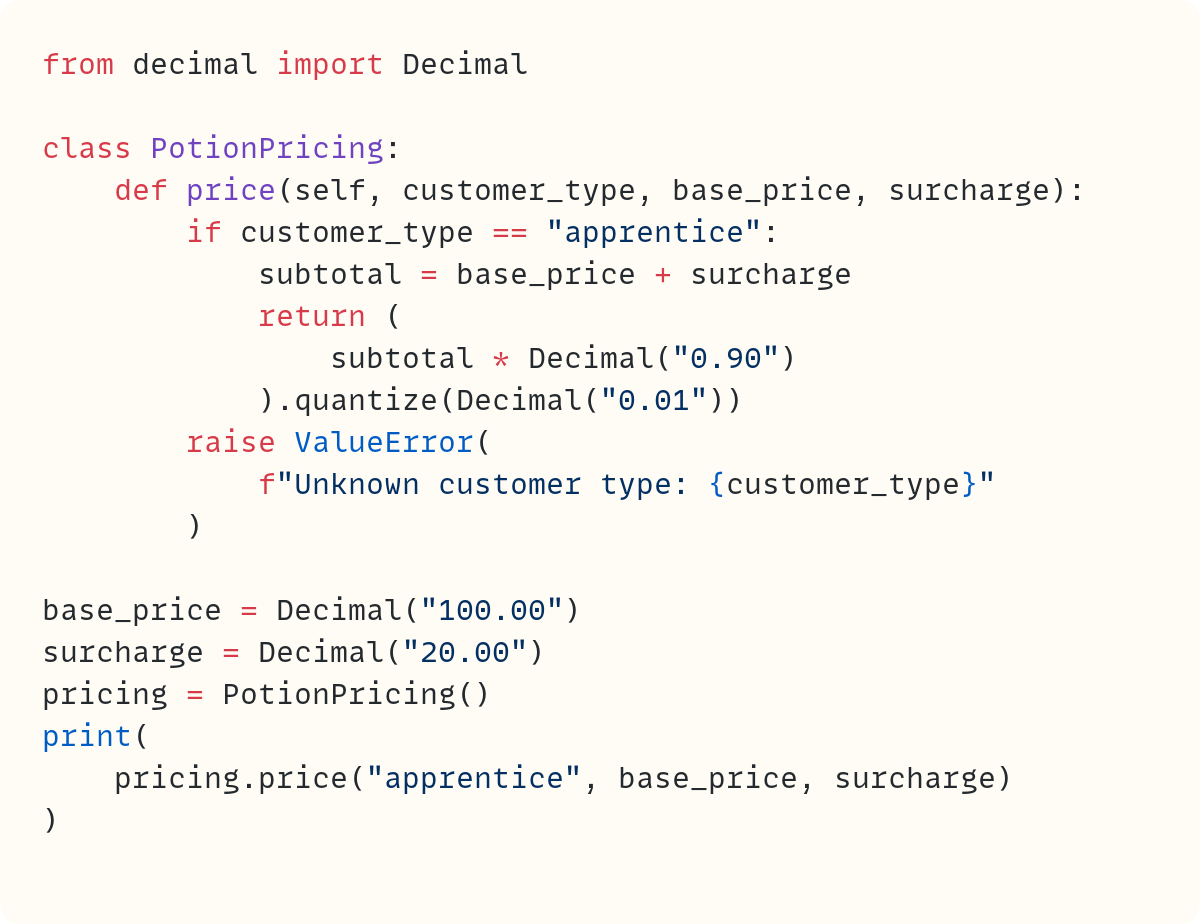
You’ll get this output when you run the code:
108.00The apprentice discount applies after adding the surcharge. That’s the rule for apprentice discounts.
A Few Months Later…
A few months pass. A different programmer is asked to add a price for members of the local guild. Guild members should receive five per cent off the base price, while the surcharge stays fixed. For the same potion, their price should be £115.
The new programmer sees that both rules involve a percentage discount and decides to avoid repeating logic by using one shared calculation.
Add the Guild Price to the Same Class
He adds the guild rule to PotionPricing and generalises the calculation:
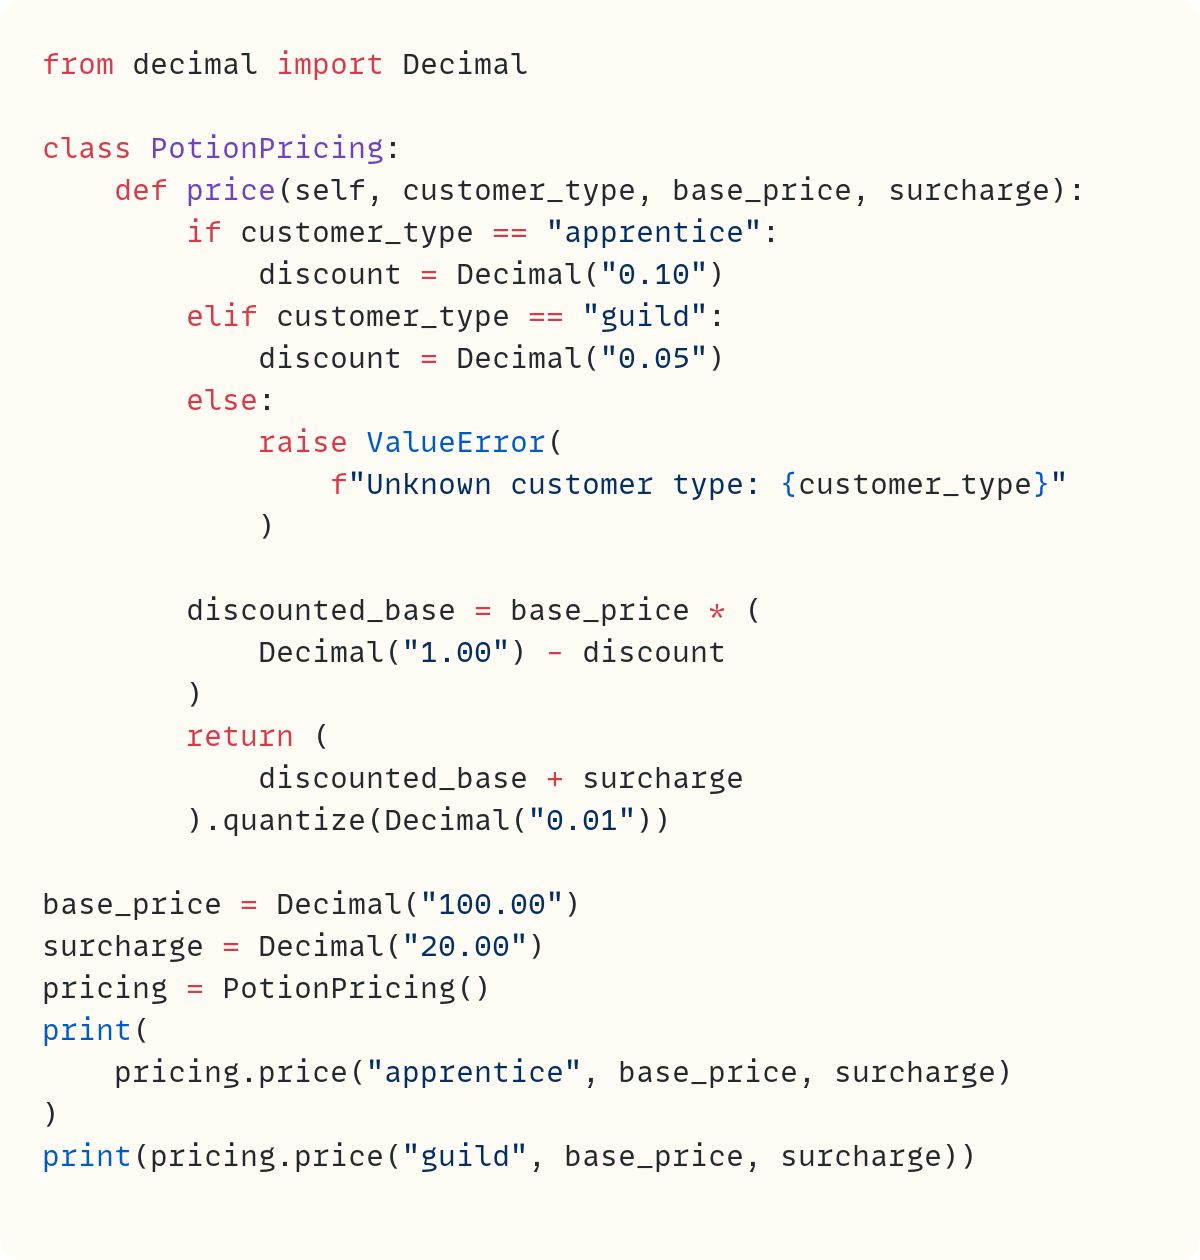
Run pricing.py again:
110.00
115.00
The guild price is right, but what happened to the apprentice price? It was £108. Now it is £110.
Apprentices are getting a worse deal now, and it’s the fault of the new programmer. But should the original programmer share some of the blame, too? Yes. Let’s see why.
The new calculation discounts only the £100 base price, then adds the £20 surcharge. That is the guild’s rule, not the apprentice rule.
The new programmer did not have to make this mistake. A careful change could have preserved the £108 price.
But adding the guild pricing meant making changes to code that already produced the correct calculation for the apprentice price. Because both rules were handled in one place, the change had an opportunity to disturb behaviour the shop had been getting right for months.
We could correct the if branches and get both prices right. But each new customer rule would still send us back into PotionPricing, where a future change could affect behaviour that already works.
Modifying existing code always carries risks. We should avoid this whenever possible. But we don’t want to prevent extensions to the code. This is the key to what we’re trying to achieve here. And that’s where the Open-Closed Principle, or OCP, comes in. This concept gives us a safer way to extend code without modifying what already works, as you’ll see in the next section.
Let Each Pricing Rule Handle Its Own Price
Instead of asking one class to choose a rule, we can represent each rule separately. First, make an ApprenticePricing class and a quote() function that delegates to whichever pricing object it receives:
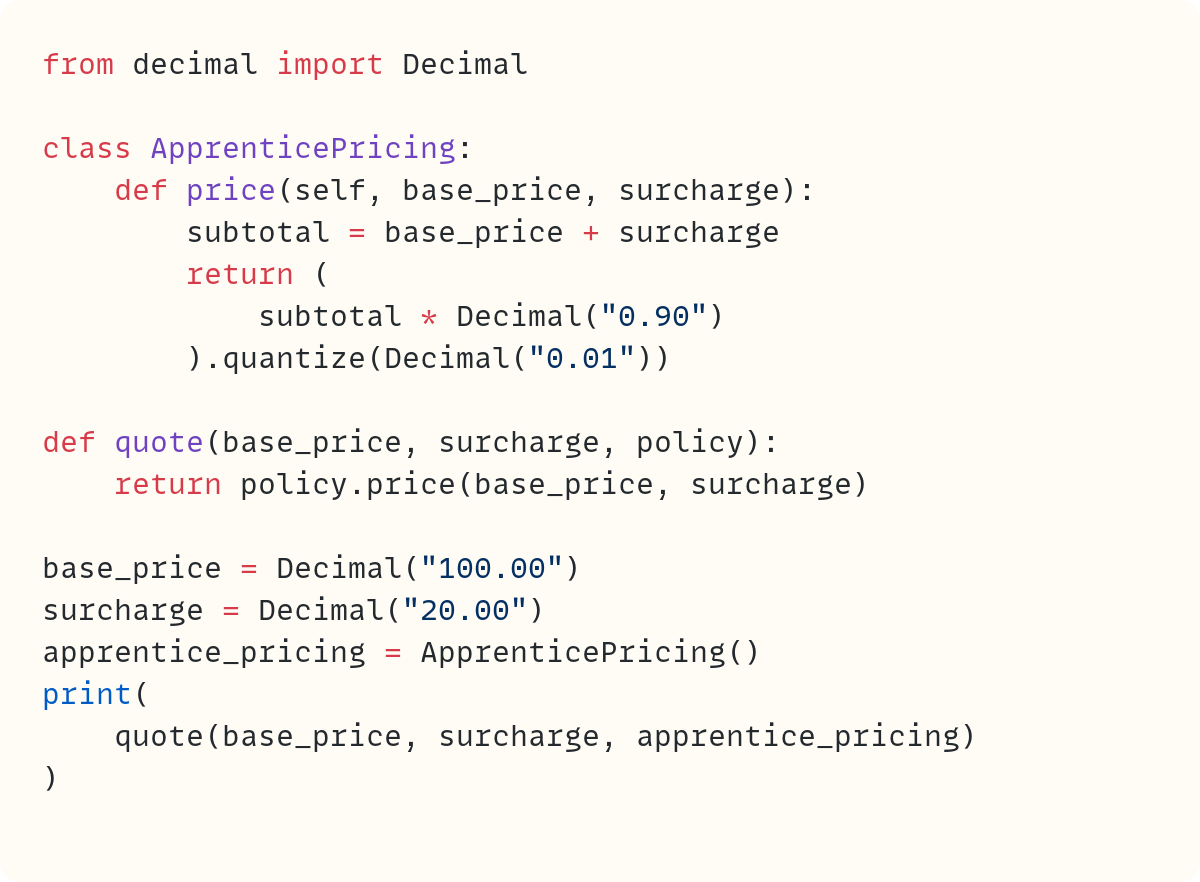
Run pricing.py:
108.00The apprentice price is back to £108. The quote() function does not need to know how the policy calculates its price. It only needs an object with a .price() method.
Now add a class for the guild rule. Leave ApprenticePricing and quote() as they are, and add GuildPricing:
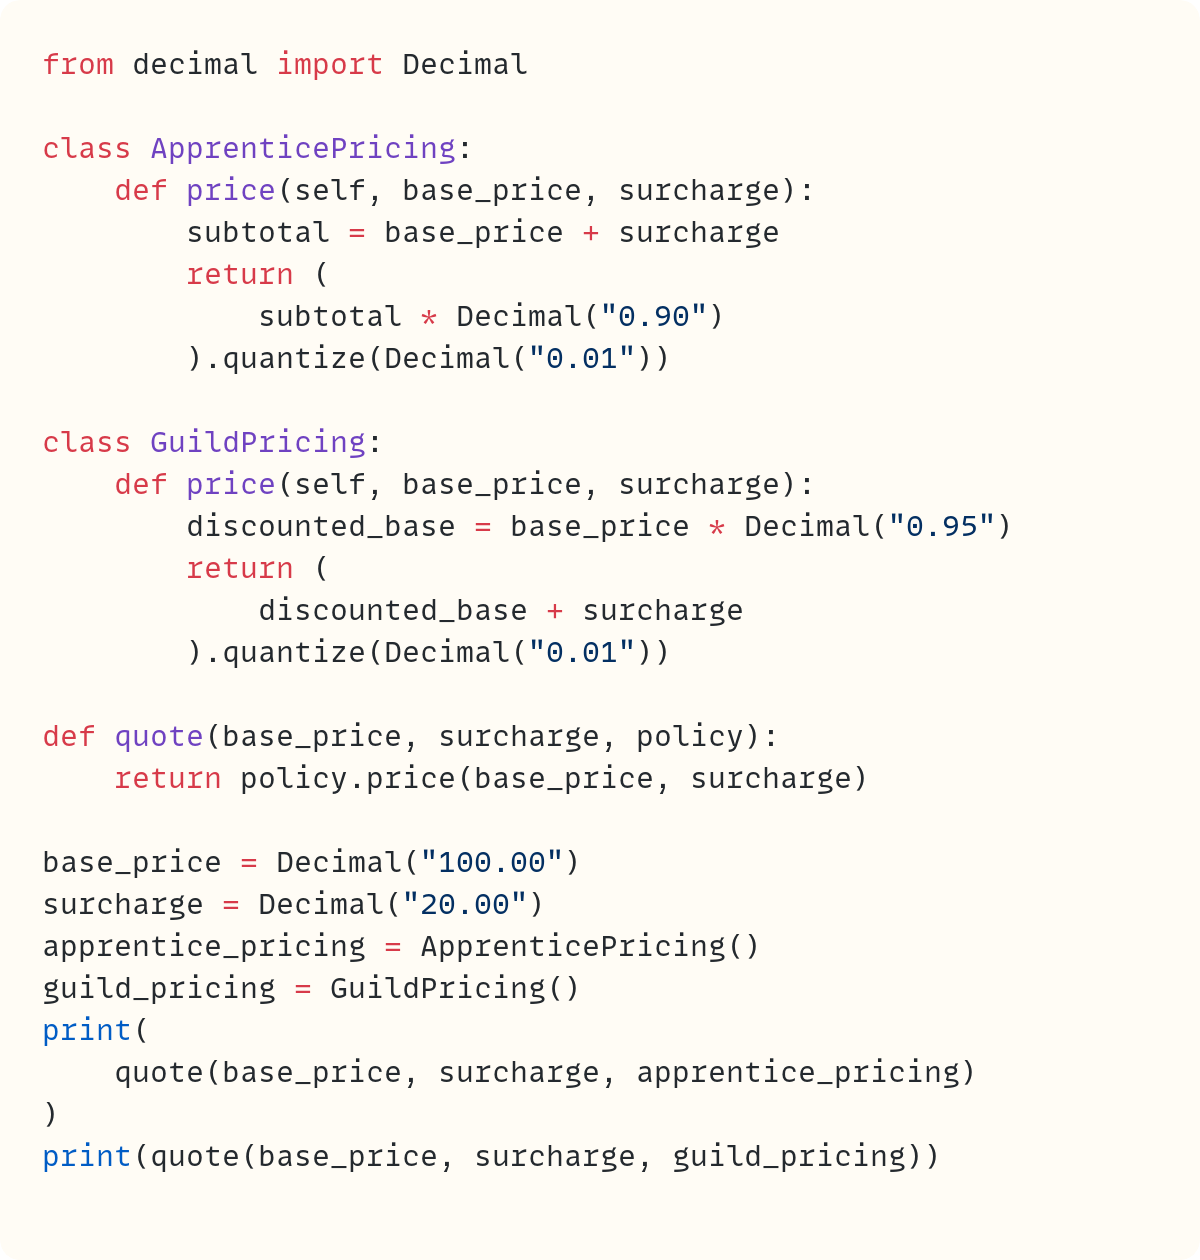
Run the file once more:
108.00
115.00
The first price is still £108, and the guild price is £115. Adding the guild rule did not require us to change the apprentice calculation or the quote() function. We added a new policy that works with the existing quote() interface.
This is the safety gain here. Adding guild pricing does not send the programmer back to edit the code that produces the apprentice price. The new policy could still contain a mistake, but it is much harder for that mistake to change the established apprentice calculation by accident.
Where OCP Appears in This Example
The Open–Closed Principle says that software should be open to extension but closed to modification. Here, quote() is open to different pricing policies: it can use any object with the right .price() method. When we add guild pricing, we extend the program with GuildPricing instead of modifying ApprenticePricing or teaching quote() about a new customer type.
This is one way to apply OCP. The policy objects use a strategy-style design with Python’s duck typing. They do not need a shared parent class.
However, it’s possible to use abstract base classes or protocols to implement code using the OCP, too. Read And Now You Know Your ABC for an example of abstract base classes. For protocols, see the Python documentation for `typing.Protocol`.
Classes are not required by OCP, and separating responsibilities alone does not make a design open for extension. The important part is the boundary that lets us add a rule without changing the stable code that already handles another rule.
That boundary does not make bugs impossible. GuildPricing could still calculate the wrong amount, or a caller could choose the wrong policy. OCP narrows which existing code needs to change when behaviour is added. It does not guarantee every new change is correct.
This extra structure is useful when pricing rules really do vary and new ones are likely. If the shop is unlikely to add more tiers, the separate classes may cost more to understand than they save. The useful question is not “How can we prevent all modification?” It is “Which part is likely to vary, and can we add that variation without disturbing behaviour that already works?”
This is the second article in a series on the SOLID principles. I’ll look at what each principle means, but more importantly, why it matters and what can go wrong when we ignore it.

Code in this article uses Python 3.15.
Do you want to keep up with how Python programming and the art of making things are changing in this rapidly changing world? Then don’t miss out on the exclusive content for premium members here on The Python Coding Stack.
I’ll be sharing more about how my programming, my daily work, and how everything has changed over the recent months.
Also, are you interested in technical writing? You’d like to make your own writing more narrative, more engaging, more memorable? Have a look at Breaking the Rules.
And you can find out more about me at stephengruppetta.com.
Appendix: Code Blocks
Code Block #1
from decimal import Decimal

class PotionPricing:
    def price(self, customer_type, base_price, surcharge):
        if customer_type == "apprentice":
            subtotal = base_price + surcharge
            return (subtotal * Decimal("0.90")).quantize(Decimal("0.01"))
        raise ValueError(f"Unknown customer type: {customer_type}")

base_price = Decimal("100.00")
surcharge = Decimal("20.00")
pricing = PotionPricing()
print(pricing.price("apprentice", base_price, surcharge))
Code Block #2
from decimal import Decimal

class PotionPricing:
    def price(self, customer_type, base_price, surcharge):
        if customer_type == "apprentice":
            discount = Decimal("0.10")
        elif customer_type == "guild":
            discount = Decimal("0.05")
        else:
            raise ValueError(f"Unknown customer type: {customer_type}")

        discounted_base = base_price * (Decimal("1.00") - discount)
        return (discounted_base + surcharge).quantize(Decimal("0.01"))

base_price = Decimal("100.00")
surcharge = Decimal("20.00")
pricing = PotionPricing()
print(pricing.price("apprentice", base_price, surcharge))
print(pricing.price("guild", base_price, surcharge))
Code Block #3
from decimal import Decimal

class ApprenticePricing:
    def price(self, base_price, surcharge):
        subtotal = base_price + surcharge
        return (subtotal * Decimal("0.90")).quantize(Decimal("0.01"))

def quote(base_price, surcharge, policy):
    return policy.price(base_price, surcharge)

base_price = Decimal("100.00")
surcharge = Decimal("20.00")
apprentice_pricing = ApprenticePricing()
print(quote(base_price, surcharge, apprentice_pricing))
Code Block #4
from decimal import Decimal

class ApprenticePricing:
    def price(self, base_price, surcharge):
        subtotal = base_price + surcharge
        return (subtotal * Decimal("0.90")).quantize(Decimal("0.01"))

class GuildPricing:
    def price(self, base_price, surcharge):
        discounted_base = base_price * Decimal("0.95")
        return (discounted_base + surcharge).quantize(Decimal("0.01"))

def quote(base_price, surcharge, policy):
    return policy.price(base_price, surcharge)

base_price = Decimal("100.00")
surcharge = Decimal("20.00")
apprentice_pricing = ApprenticePricing()
guild_pricing = GuildPricing()
print(quote(base_price, surcharge, apprentice_pricing))
print(quote(base_price, surcharge, guild_pricing))
Python Insider
Python 3.15.2, 3.14.10, 3.13.18, 3.12.16 and 3.11.18 are out
Five expedited security releases to distrust the compromised eMudhra intermediate CA keys.
Stein Magnus Jodal
Introduction to barcode parsing
Barcodes are everywhere.
They’re so omnipresent that we easily take them for granted, and rarely think about their existence and how they really work. Meanwhile, barcodes are extremely important for all kinds of logistics, the foundation of modern society.
This post is an introduction to barcode parsing, and to all the corner cases that make it a bad idea to write your own barcode parser.
October 25, 2026
The No Title® Tech Blog
Just updated - Optimize Images v2.2.0
Optimize Images 2.2.0 has just been released, and it makes JPEG files even smaller by default, adds an optional SSIM-based quality check, and now keeps embedded colour profiles such as the Display P3 profile of iPhone photos. It also requires Pillow 13.0.0 for important security fixes, and makes batches and watch mode more reliable.
October 24, 2026
Go Deh
Finding Flaws in Technical Documentation

An idea
I spent some time on a project and had finished updating the tutorials and reference documentation I'd created as Markdown .md files. Then I suddenly thought:
Why not use the AI to test the documentation?
So I asked ChatGPT if it could create an isolated new chat that read just the project's .md documentation files and then tried to use the tool.
Putting it to the test
My current chat session said it could, created a new chat, and expanded my sentence into an initial prompt that included a lot more detail on what to do and what it could not do.
It came back to me and said it would run and monitor the new chat and report back on any documentation deficiencies it found.
That led to several points, some valid and some not, that I then addressed.
One example was that the documentation didn't explicitly state that the tool was intended for Linux use. It included setup details for Linux and WSL, but that hadn't stopped the AI from trying to work out how to run it in a Windows environment.
An obvious assumption on my part, perhaps, but one worth making explicit.
A new, (to me), way to review documentation
I like the idea of getting AI to act as someone new to a project, trying to get something done and reporting on any problems encountered along the way.
It's a way of testing the documentation by actually trying to follow it, rather than just asking AI to review the wording.
Of course, the AI won't always get it right. Some of the points it raised weren't valid, so you still need to use your own judgement when deciding what to change.
Documentation for humans and AI
You still have to make documentation approachable for any user, without requiring them to use AI. But I'd expect more of my target audience to use AI to help them work with projects.
That means documentation has to serve two purposes: it needs to be usable by people reading it directly, but also clear enough for an AI assistant to use when helping someone get things done.
I'm not suggesting we should write documentation just for AI. But if AI is going to be another way people interact with our projects, it makes sense to consider how well our docs support that.
Perhaps we should be testing documentation in much the same way we test code: by seeing whether someone, or something, can actually follow it and accomplish the intended task.
Something worth trying on your next project?
LernerPython blog, from Reuven Lerner
Pandas MultiIndex: Select rows by the outer level with loc
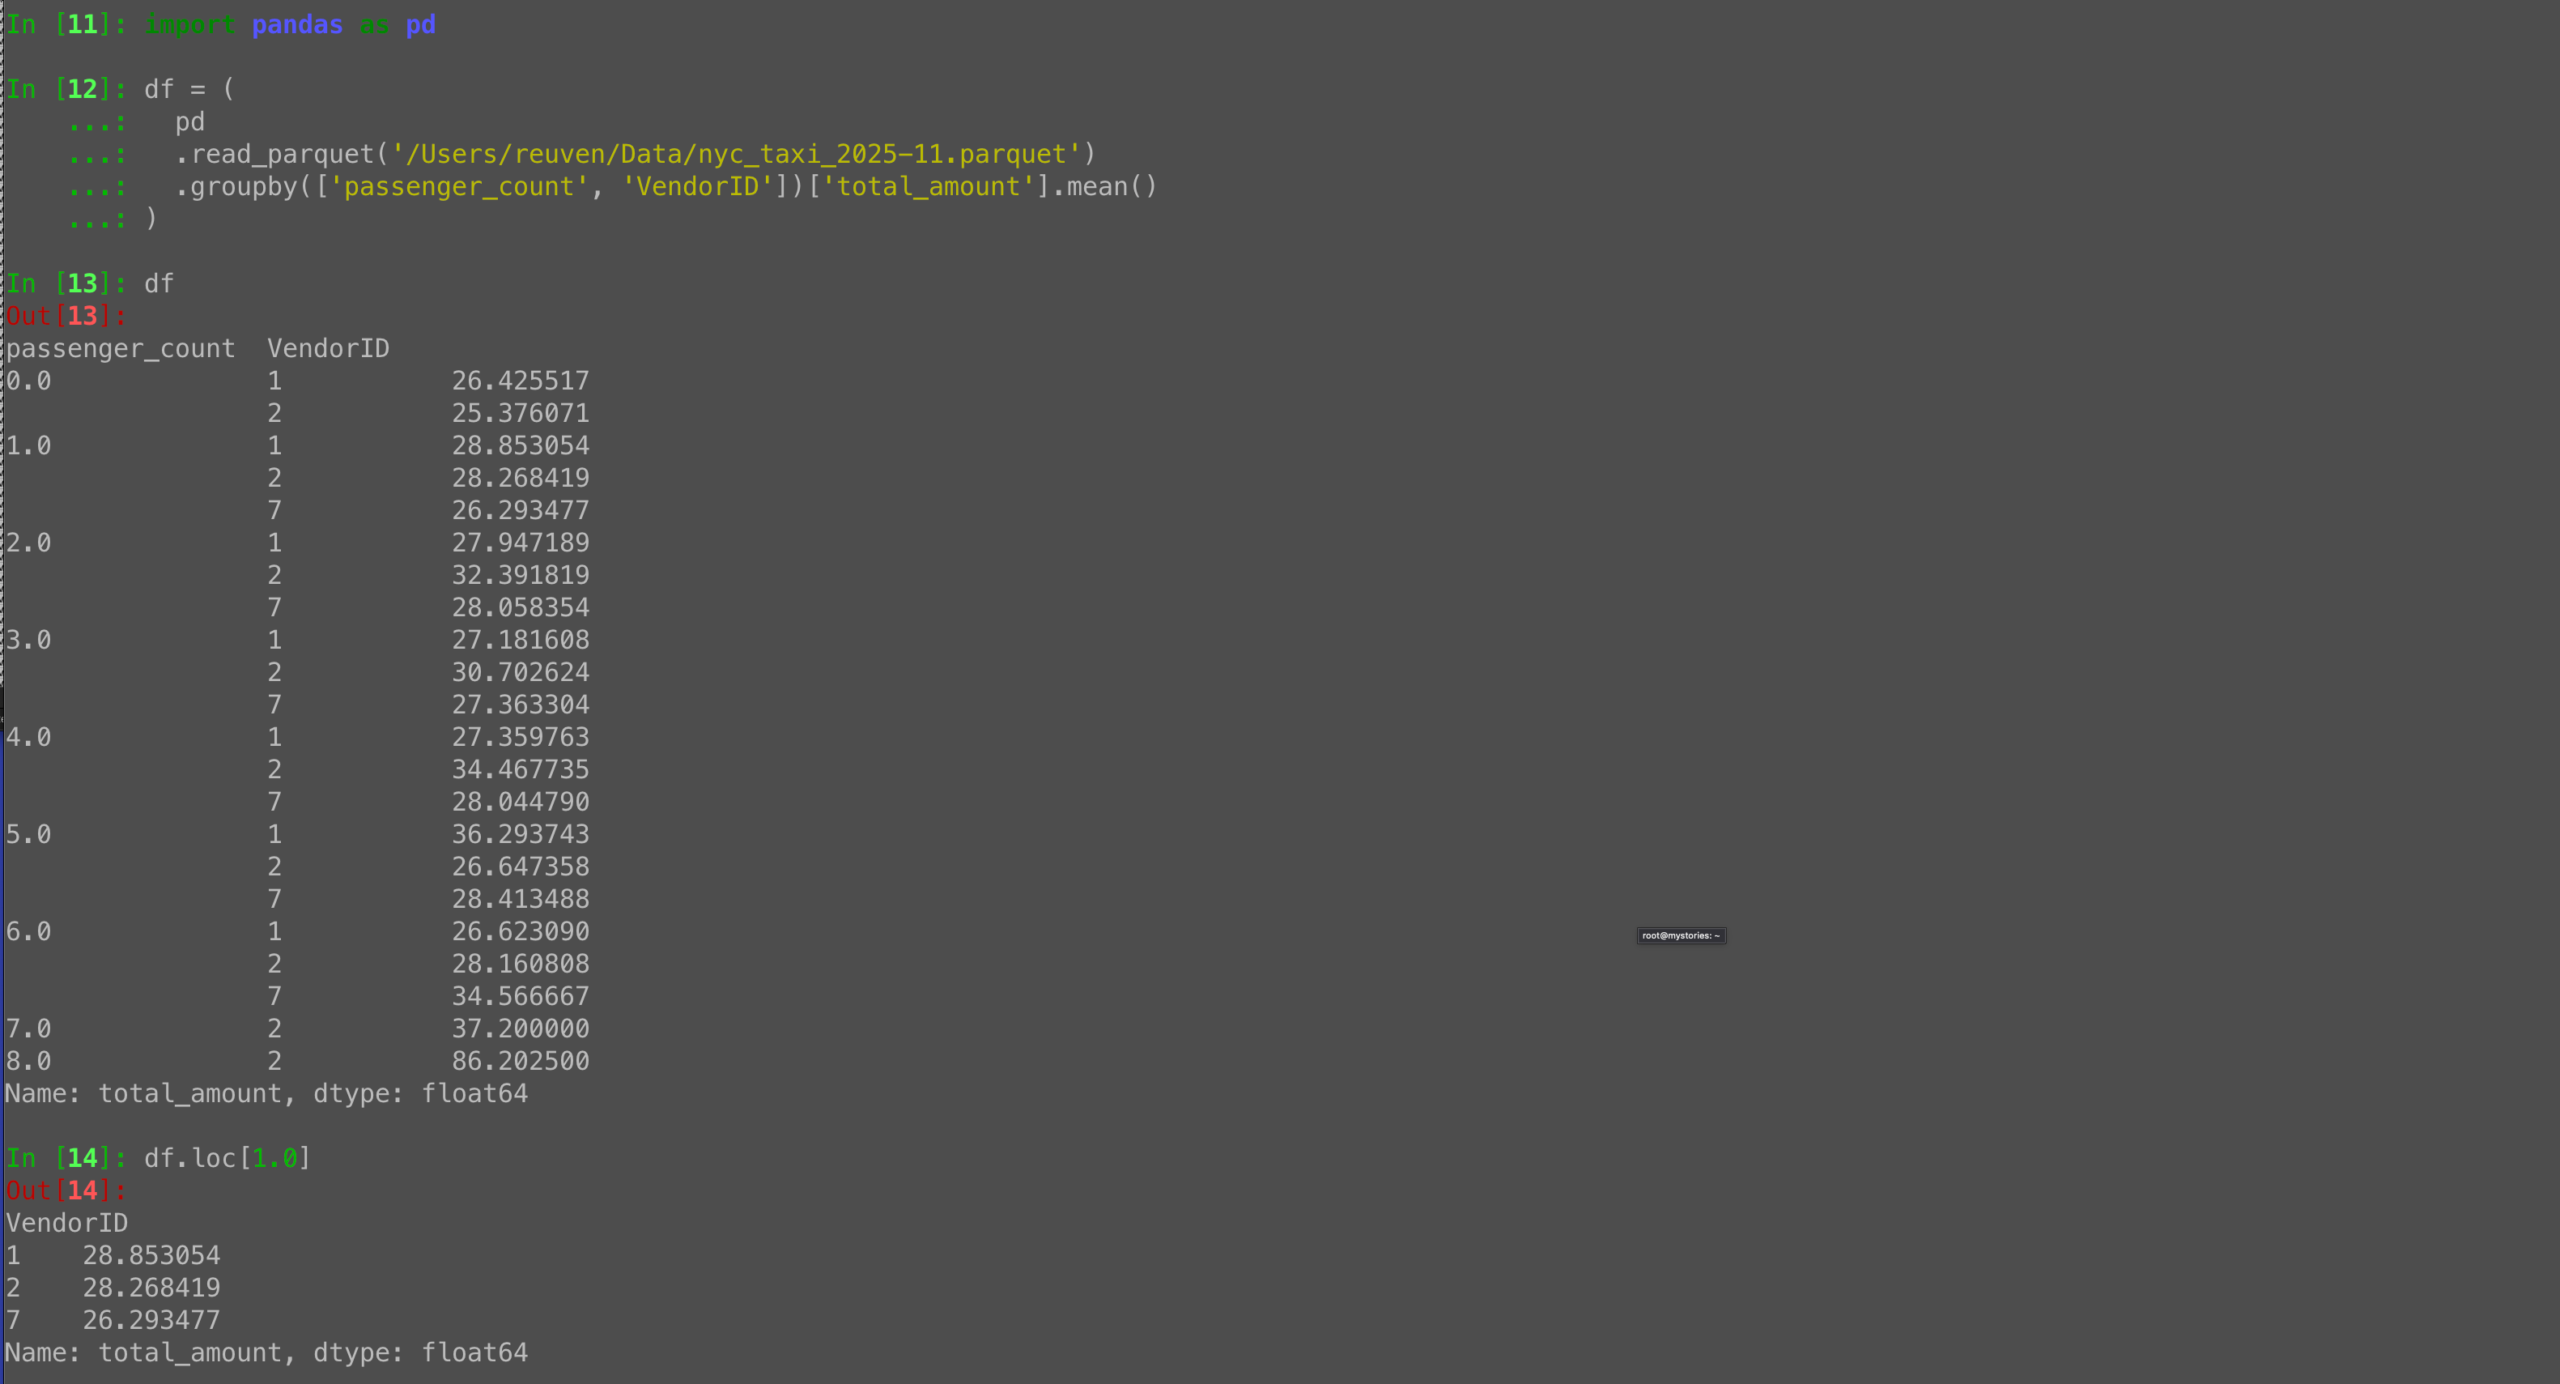
To retrieve all rows from a multi-indexed Python Pandas data frame or series based on the outermost index, use “loc”:
(
  pd
 .read_parquet('/Users/reuven/Data/nyc_taxi_2025-11.parquet')
 .groupby(['passenger_count', 'VendorID'])['total_amount'].mean()
 .loc[1.0]
)
The post Pandas MultiIndex: Select rows by the outer level with loc appeared first on LernerPython.
October 23, 2026
LernerPython blog, from Reuven Lerner
Pandas offset aliases for resample: ME, MS, and other codes
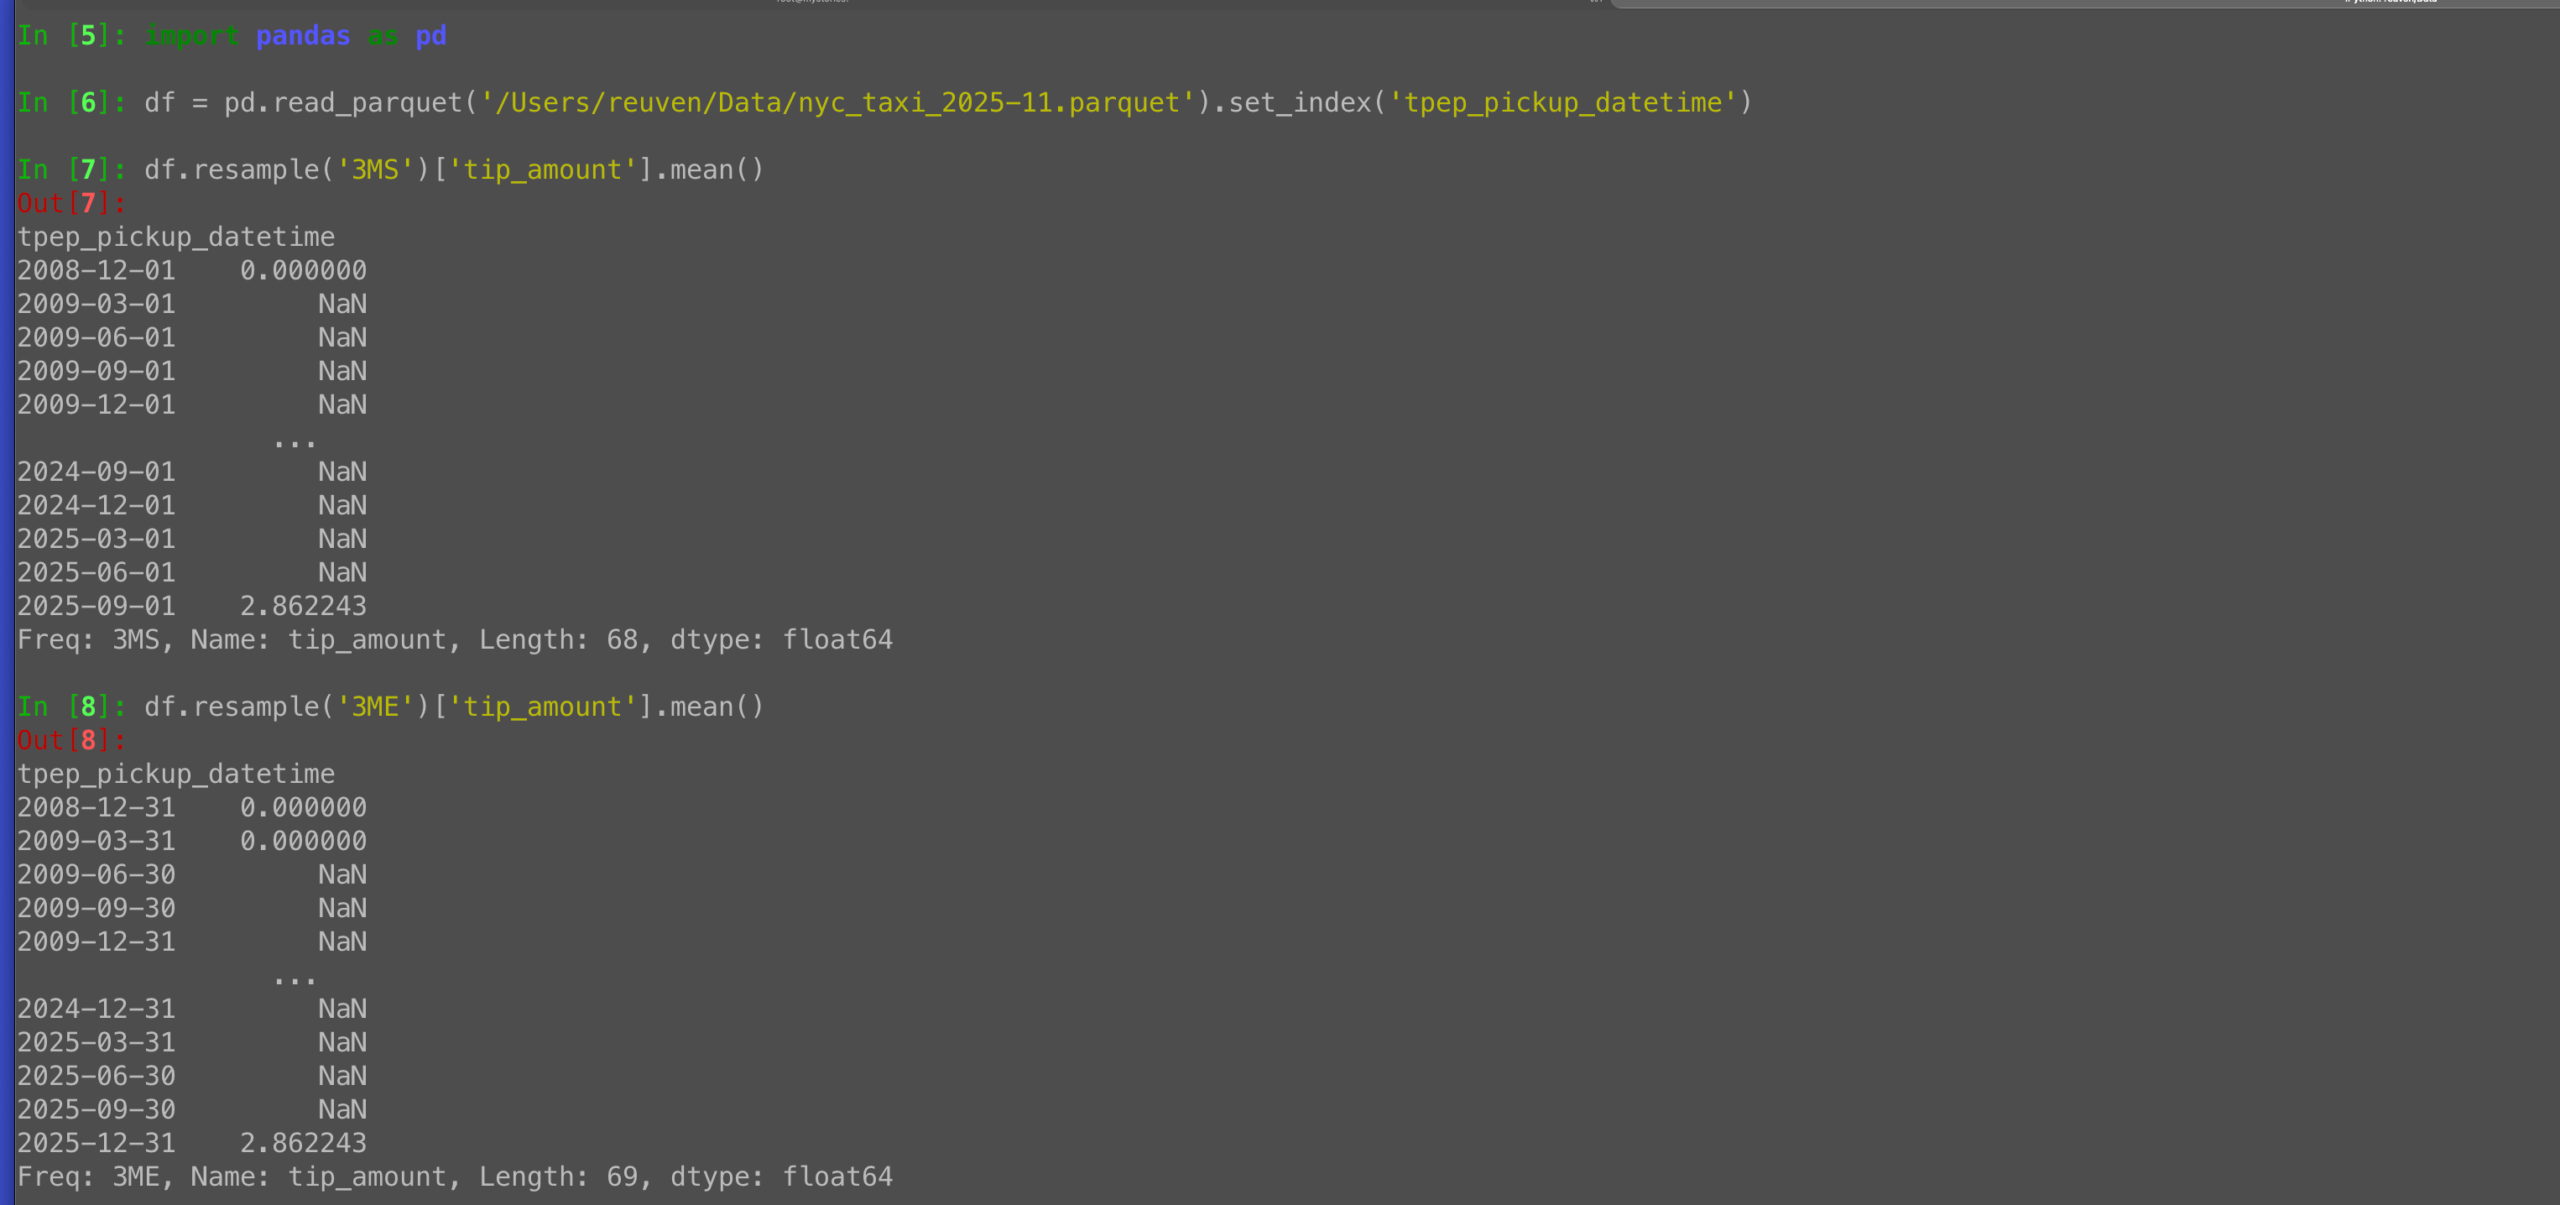
Using resample in Python Pandas? You’ll want a list of “offset aliases,” the codes that let you specify units.
Some are surprising, such as “ME” and “MS” for “month end” and “month start”.
They’re at: https://pandas.pydata.org/docs/user_guide/timeseries.html#offset-aliases
The post Pandas offset aliases for resample: ME, MS, and other codes appeared first on LernerPython.
October 22, 2026
Daniel Roy Greenfeld
TIL: How to extract subtitles from video
Recently I've been making more and more videos for my youtube channel. I like videos with subtitles, and decided to add them to my own efforts. This is what I do:
This command assumes you have uv and ffmpeg installed.
uvx --python 3.14 --from openai-whisper whisper "name-of-video.mp4" \
  --model small \
  --language English \
  --task transcribe \
  --output_format srt \
  --output_dir captions \
  --fp16 False
The output is put in a captions directory, named after the .mp4 file that is its source.
As a zsh function:
subtitle() {
  uvx --python 3.14 --from openai-whisper whisper "$1" \
    --model small \
    --language English \
    --task transcribe \
    --output_format srt \
    --output_dir captions \
    --fp16 False
}
Mariatta
Python Core Sprint 2026: Day 3
Day 3 of the Python Core Sprint, yesterday, was my last day in the room. Today I’m traveling to Seattle for SeaGL, where I’m one of the keynote speakers. With the bots settled on Cabotage and Heroku scaled to zero, I had the day for the smaller things that had been waiting on the follow-up list.
A prompt generator for NEWS entries, and why I closed it
One of the open pull requests in blurb_it was #456, from An Long (aisk), opened back in July. It added a button to the “add blurb” page that generates a prompt. The contributor copies the prompt into ChatGPT, Claude, Gemini, or DeepSeek, and pastes the resulting NEWS entry back into blurb_it. The prompt includes links to the issue, the PR, the diff, and the changed files, plus the devguide’s guidance on how to write a NEWS entry.
Rodrigo Girão Serrão
Module profiling overview

Learn about the new module profiling that was introduced in Python 3.15 to organise the built-in profiling tools.
The standard library module profiling organises the built-in profiling tools that Python has into a single namespace.
Introduced in Python 3.15, it gives access to two different profilers: a sampling profiler called Tachyon, and a tracing profiler.
This article will present an overview of those two profilers.
15 days of Python 3.15
To celebrate the release of Python 3.15, over the next 15 business days I'll be writing about a new 3.15 feature every day. Explained clearly and with examples so you don't have to sift through the changelog.
Subscribe to receive this free email series:
If you want, you can also check the schedule of the upcoming emails.
Historical note
Before Python 3.15, Python had a module in the standard library called profile.
The module profile was a pure-Python profiler that was of little practical use.
This module was deprecated in Python 3.15 and is scheduled for removal in Python 3.17.
In addition to the pure-Python module profile, Python 3.14 and earlier included a tracing profiler called cProfile.
This profiler now lives under profiling.tracing and it's one of the tools you'll learn about in this article.
Understanding the two Python profilers
The Python standard library provides two profilers under the module profiling:
profiling.sampling: a statistical profiler that uses high-frequency sampling to profile your code with virtually zero overhead. This profiler is commonly known as Tachyon.profiling.tracing: a tracing profiler that instruments your code to profile your code deterministically but with some overhead. This profiler used to be called cProfile.
The key difference between...
Tryton News
Information regarding eMudhra / emSign CA certificate security incident
Following Information for Python users regarding eMudhra / emSign CA certificate security incident - Announcements - Discussions on Python.org, we have updated the Docker images of Tryton because certifi is an indirect dependency of Tryton.
It is recommended to update your deployment to use the updated images.
If you deploy Tryton using a virtual environment, it must be updated following the instructions.
1 post - 1 participant
Python Software Foundation
Mark Your Calendars! PSF Board Office Hours for the Year Ahead
Greetings, Pythonistas- thank you so much for supporting the work of the PSF and the Python community! The newest PSF Board has decided to continue investing in connecting with the global Python community by running the PSF Board Office Hour sessions on the PSF Discord into 2027.
We began running these sessions in September 2024, and they have proven to be a great method for the community to connect with the board and vice versa. This venue has been invaluable to the PSF as we work on critical areas over the last year such as the PSF Strategic Plan, elections, and the recent PSF Grants Program Funding Round. The sessions have also provided the PSF Board and Staff the opportunity to hear what our community is up to and what challenges they are facing.
What are the PSF Board Office Hours?
During the PSF Board Office Hours, you can participate in a text-based live chat with PSF Board Directors. This is a chance to connect, share, and collaborate with the PSF Board and Staff to improve our community together. Occasionally, we will have dedicated topics such as PyCon US and the PSF Board Elections for the office hour sessions.
Here is some of the work that we collaborate with staff and volunteers on:
- Promotion and outreach for the Python programming language
- Supporting local Python communities
- Organizing PyCon US
- Diversity and Inclusion in our community
- Support handling Code of Conduct issues within our communities
- Support regional Python communities via the PSF Grants Program
- Furthering the mission of the PSF
Unless we have a dedicated topic for a session, you are not limited to talking with us about the above topics, although the discussions should be focused on Python, the PSF, and our community. If you think there’s something we can help with or we should know, we welcome you to come and talk to us!
Joining the office hours
The office hour sessions will take place on the PSF Discord server in the #psf-board channel. If you are new to Discord, make sure to check out a tutorial on how you can download the app and sign up for free– then join us on the PSF Discord! To make the office hours more accessible, the office hours will be scheduled at alternating times, so no matter where you are based, you can find a time that is most convenient for you! Here is a list of the dates and times:
- November 10th, 2 pm UTC
- December 8th, 9 pm UTC
- January 12th, 2 pm UTC
- February 10th, 9 pm UTC
- March 9th, 1 pm UTC
- April 13th, 9 pm UTC
- May 11th, 1 pm UTC
- June 8th, 9 pm UTC
- July 13th, 1 pm UTC
- August 10th, 9 pm UTC
- September 8th, 1 pm UTC
- October 12th, 9 pm UTC
Each session lasts for an hour. Sessions after October 2027 will be announced in the future.
Who will be at the office hours?
Some board members of the PSF will be attending each office hour, as well as members of the PSF Staff. The list of the PSF Board Directors can be found on our website. We are passionate Python community members who are excited to listen, help, and provide support to you. We are happy to follow up with you if there are any issues we cannot address immediately during the office hour sessions. As always, you can email us at psf-board@python.org with inquiries, feedback, or comments any time.
Peter Hoffmann
Loading 33,000 Peaks on Demand with a z10 Tile Grid
biwak.info is my mobile-first map of Alpine huts and bivouacs. Recently I wanted to add peaks: tap anywhere near a summit and get its name, elevation, prominence, a photo and the Wikipedia link. The data for that comes from OpenStreetMap and Wikidata: 33,437 named peaks between Nice and Vienna.
As a single peaks.json file this is 15.4 MB (1.8 MB gzipped). That's fine for
a desktop, but on a phone with one bar of signal in a valley it is not, and most
of it is never used: you look at one valley, not the whole Alps.
The site is hosted as plain static files, without a database or an application server, and I wanted to keep it that way. So the question was: how do you load only the peaks the user is looking at, using nothing but files?
Use the map's own tile grid
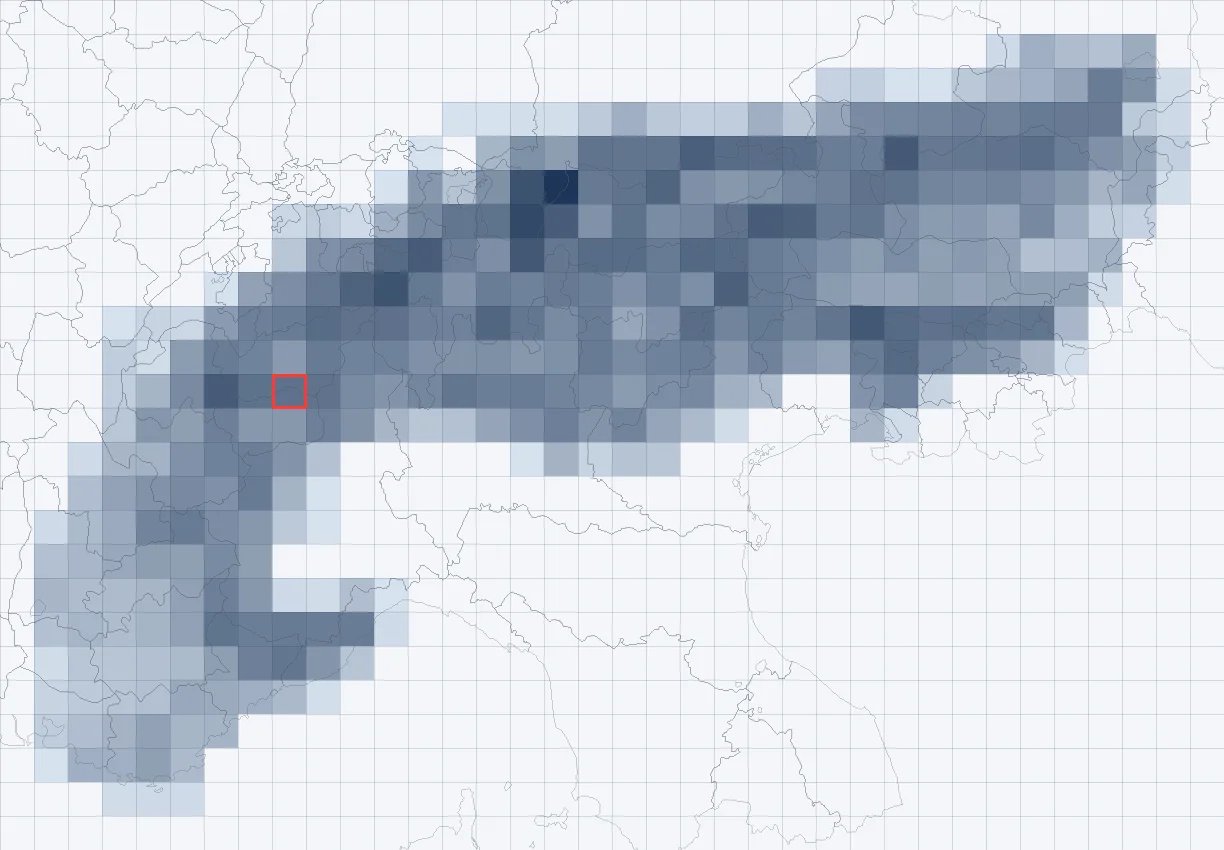
Leaflet already splits the world into a grid: the slippy map tiles z/x/y that
every OpenStreetMap-style basemap uses. At zoom level z there are 2^z × 2^z
tiles, and any coordinate maps to exactly one of them with two lines of math:
def lon2x(lon, z=10):
    return math.floor((lon + 180) / 360 * 2**z)


def lat2y(lat, z=10):
    lat_rad = math.radians(lat)
    return math.floor((1 - math.log(math.tan(lat_rad) + 1 / math.cos(lat_rad)) / math.pi) / 2 * 2**z)
The idea: cut the peaks into files along that same grid at one fixed zoom
level, one JSON file per tile. The browser computes which tiles cover the
current view and fetches only those. Because the build (Python) and the client
(JavaScript) use the same formula, they always agree on which file a peak is in.
The floor also means every peak belongs to exactly one tile, so nothing is
duplicated.
The Matterhorn (45.97639, 7.65833) for example lands in tile 10/533/364. I keep
a handful of these as unit test fixtures for the build and the client.
Why zoom level 10
The zoom level of the data grid is independent of the zoom level the map is showing. It is a trade-off between the number of requests and the size of each file:
- A z10 tile is about 27 × 27 km in the Alps.
- Peaks are only drawn from map zoom 12 on. There a phone screen (390 × 790 px) shows roughly 10 × 21 km. With a 25% margin around the view to preload neighbours, a view touches at most 6 tiles at zoom 12 and 4 at zoom 13.
- The whole Alps fit into 356 non-empty tiles. A tile holds 93 peaks in the
median, the densest one 348: tile
541/358in the Allgäu Alps, with the Hochvogel and Krottenkopf. - A tile is 13 KB of JSON in the median (3.6 KB gzipped), the largest 87 KB.
At z9 the tiles would hold four times as many peaks, so most of each download would be off-screen. At z11 a view would need four times as many requests. z10 is the sweet spot for this density of data.
The build: one small file per tile
A Python script (tools/build_peaks.py) reads the big peaks.json and writes
the grid:
data/peaks/manifest.json      non-empty tiles with peak counts
data/peaks/10/{x}/{y}.json    one file per tile
Each tile is a compact table: a fields header and one array per peak, instead
of repeating the key names thousands of times. Coordinates are stored as integers
in 1e-5 degrees, which is about one meter and saves the long float strings:
{"cat": 1,
 "fields": ["id", "lat_e5", "lon_e5", "ele", "rank", "name", "prominence", "wikipedia", "wikidata", "image", ...],
 "rows": [
   ["n26863664", 4597643, 765860, 4478, 3, "Matterhorn", 1038, "it:Cervino", "Q1374", "https://...", ...],
   ["n1436639948", 4603418, 761193, 4358, 3, "Dent Blanche", 915, null, "Q15125", "https://...", ...]
 ],
 "x": 533, "y": 364, "z": 10}
The manifest lists only the tiles that exist (7 KB). The client checks it first and never requests a tile over the Po valley or the Mediterranean that would only return a 404.
The build is deterministic: the same input gives byte-identical files. That
keeps the git diffs readable when the OSM data changes, and rsync only uploads
the tiles that really changed.
Not every peak at every zoom
At zoom 12 the Alps are full of small bumps that are technically named peaks. So every peak gets a rank from 0 to 3 at build time. The rank comes from the prominence (how far you have to descend before you can climb anything higher) or, if that is unknown, from the isolation (the distance to the nearest higher peak):
def peak_rank(ele, prominence, isolation_km):
    if ele is None:
        return 0
    if prominence is not None:
        return 3 if prominence >= 500 else 2 if prominence >= 150 else 1 if prominence >= 50 else 0
    if isolation_km is None:
        return 0
    return 3 if isolation_km >= 5 else 2 if isolation_km >= 2 else 1 if isolation_km >= 0.8 else 0
That gives 1,558 peaks with rank 3, 7,385 with rank 2, 18,015 with rank 1 and 6,479 with rank 0. The rows in each tile are sorted by rank, then by elevation. The map shows rank ≥ 2 at zoom 12, rank ≥ 1 at zoom 13 and everything from zoom 14 on.
The client: fetch what the view needs
In the browser (peaks.js) it all hangs off Leaflet's moveend event. From zoom
11 on, one zoom level before anything is drawn, the visible bounds plus a 25%
margin are turned into tile keys. Missing tiles are queued:
function* tileKeys(bounds) {
  const x0 = lon2x(bounds.getWest()), x1 = lon2x(bounds.getEast());
  const y0 = lat2y(bounds.getNorth()), y1 = lat2y(bounds.getSouth());
  for (let x = x0; x <= x1; x++) for (let y = y0; y <= y1; y++) yield `${x}/${y}`;
}

function loadVisiblePeakTiles() {
  if (!peakManifest || map.getZoom() < LOAD_FROM_ZOOM) return;
  for (const key of tileKeys(map.getBounds().pad(VIEW_PAD))) {
    if (!(key in peakManifest.tiles) || peakTiles.has(key) || peakTileState.has(key)) continue;
    peakTileState.set(key, 'loading');
    fetchQueue.push(key);
  }
  pumpFetchQueue();
}

map.on('moveend', loadVisiblePeakTiles);
A few details made it work well on a phone:
- At most 4 requests in parallel, so a fast pan doesn't fire a dozen fetches at once. A failed tile is retried once after two seconds and otherwise skipped for the session. The map keeps working, just without peaks in that square.
- An LRU of 64 tiles. A JavaScript
Mapkeeps insertion order, so deleting and re-inserting a key on every use turns it into an LRU for free. When there are more than 64 tiles, the least recently used ones are dropped, but never one that is in the current view. - Rows become objects shaped like the hut records, so the existing detail view shows peaks without any changes.
Drawing: one canvas, no markers
33,000 Leaflet markers would be far too heavy, and the basemap
(OpenTopoMap) already prints peak names and
elevations. So the peaks layer is a single <canvas> on its own map pane that
draws small, slightly transparent grey triangles after each move. During a zoom
animation the canvas is hidden, because it isn't transformed with the map. It
is redrawn on zoomend.
Tapping is a nearest-neighbour search over the loaded tiles: anything within 30 px of the tap counts, from zoom 12 on. The search box can span a tile border, so it looks at all tiles it touches. A peak right at the edge of its tile is still found when you tap just across the line.
Deep links come for free
Since then every hut and peak also has a stable URL like
biwak.info/p/matterhorn. For a peak, the slug
lookup only needs to store its coordinates: the client computes the tile from
them with the same lon2x/lat2y, fetches that one file and opens the peak.
The grid works as a spatial index that needs no extra code.
What I'd do next
- More categories. Passes, viewpoints, springs and drinking water can use the same grid. Their files only need a category field and a per-category count in the manifest, so the client can skip tiles without any enabled category.
- Vector tiles. If the map ever moves to MapLibre, the same build pipeline could write MVT tiles instead of JSON. The grid and the ranking would stay.
For data of this size, tens of thousands of points over a mountain range, the plain file grid works very well: no server, no database, a few kilobytes per view, and the whole thing is about 430 lines of Python and JavaScript.
Zero-with-Dot (Oleg Żero)
Text-to-Diagram for AI Systems: Designing a DSL an LLM Gets Right
Introduction
I have worked on sensor design, e-commerce, airlines, medicine and CAD software, in several countries. The domains could not be more different, yet one problem kept coming back: people do not understand each other. Not because they are careless. Everybody simply looks at the same system from a different side. Legal sees data, the CEO sees cost, DevOps sees uptime.
Take one sentence from a kick-off meeting:
“We are building an agent to fix invoices.”
What does fix mean? Who uses it? Does it see customer data? Where does it run, and who owns it? Nobody asks, because everybody thinks they know. A year later the project has five different answers to each of those questions.
Large language models make this more urgent, not less. Anybody can now describe a system in a paragraph, and a model will happily draw it. The open question is whether that drawing is the architecture, or just an architecture.
Gnomon is my attempt at an answer. It is a small language, gnomocode, and a compiler that checks every statement against an ontology. A language model translates what people say into gnomocode; the compiler decides what is allowed; and the result can be drawn, queried and read back as prose. The compiler is written in Python, on top of Lark, rdflib and pySHACL.
I presented it as a keynote at DevAI by Data Science Summit in Warsaw on 20 October 2026, under the title of this article. This is the written version of that talk: why I built Gnomon, how it works, and what the measurements say about it.
Status
Work in progress, October 2026. A public repository is being prepared. Until it exists, this article is the best description of what is built and why it looks the way it does.
Motivation
Draw the invoice agent and you are done in five seconds: invoices go in, an agent does something, fixed invoices come out. The box is easy. The questions around it are the architecture: who owns the data, where the model runs, whether personal data is involved, who reviews the edge cases. That gap between words and a diagram somebody can be held to is what I wanted to close.
It has to work in both directions. Forward, from a conversation to a model that a developer, or an agent, can build from. Backward, from existing code and diagrams to text that people can read. The forward direction is the harder one, and it is what this article is mostly about.
Before writing any code, I wrote down what a language sitting in the middle has to offer:
- unambiguous terms;
- native words for what we build today: language models, memory, tools, MCP [15], A2A [16];
- easy to read and write, by people as well as by models;
- one model, many views, one per reader;
- versions, diffs and references;
- a way to say “I am not sure”.
The last one turned out to matter more than I expected.
Approach
I did not start with a language. I started with the cheapest option and let it fail.
Just ask the model. “Draw an architecture for an agent that fixes invoices.” The answer is fluent, plausible and different every time. It invents words, gives no errors and no line numbers, and there is nothing to diff. When it is wrong, nothing tells you where.
Objects. Pydantic [12] classes, filled in by the model through structured output. Validation is real and every provider supports it. But an architecture is a graph, not a tree. A missing fact is either an error or a null, and a conversation with a client is mostly missing facts. Two statements cannot be merged, nor can they contradict each other, and every new term means a new class and a new release. The vocabulary ends up cemented in code.
Existing notations. UML, BPMN, C4 [10], ArchiMate and SysML v2 [11] are standards, and people understand them. They come with fixed symbols and a fixed depth, none of them has a “maybe”, and only some of them check whether a diagram makes sense, as opposed to whether it is drawn correctly.
A language of my own, with a compiler. This is the one that stayed. The idea is old and boring, which is how I like my ideas: let the model talk, let the compiler decide.

The translator, text2gnc, turns natural language into gnomocode. The compiler, which is plain rules with no model inside, checks each statement and builds a graph. When it finds errors, it sends them back to the translator with line numbers and hints. Everything else, diagrams for different audiences, recommendations, even prose, is drawn from the graph.
Two consequences matter to me. The script is the source of truth, not a single call to a model: the same script always compiles to the same graph. And errors are located and readable, so a person and a model can both act on them.
The ontology is the key
Before designing a single keyword, I went looking for who had already described this world. Plenty of people had. A taxonomy says what is a kind of what: a language model is a machine learning model. An ontology goes further and adds relations and rules: an agent uses a model, a model runs on an environment, and a dataset cannot run on anything at all. Such vocabularies have been written in RDF [1] for years, and some are widely used: SKOS [3] for taxonomies, PROV-O [2] for provenance, DCAT [4] for data catalogues, DPV [7] for privacy, QUDT [8] for units and schema.org [9] for the web. OWL [6] defines the classes and SHACL [5] checks the graphs.
So the rule became: take terms, relations, types and hierarchy from what exists, and add the minimum. The result is a kernel of 57 terms and twelve modules (systems, deployment, integration, data, ML, agents, processes, operations, security, legal, cost and service levels) that a script imports only when it needs them. From day one there was also a licence rule: nothing copyleft goes in, so that the whole thing can later be distributed freely and commercially.

Why call the ontology the key? Because every other part of Gnomon is generated from it or checked against it. Take a single word that a script writes, runs_on. In the ontology it has three layers: a lexicon entry that gives the word and its inverse reading, a property with a definition, and a shape that says what may stand on either side of it.
ontology (abridged)
gnlex:runs-on a skos:Concept ; skos:prefLabel "runs on"@en ;
    gn:inverseReading "hosts"@en ;
    gn:denotes gn:runsOn .

gn:runsOn a owl:ObjectProperty ;
    rdfs:label "runs on"@en ;
    skos:definition "The subject executes in or on the object."@en ;
    gn:acyclic true .

gnsh:runsOn-subject a sh:NodeShape ;
    sh:targetSubjectsOf gn:runsOn ;
    sh:or ( [ sh:class gn:System ]
            [ sh:class gn:Model ]
            [ sh:class gn:Activity ] ) ;
    sh:message "only a system, a model or an activity can run on something" ;
    gn:diagnosticCode "type/signature" .
That one definition feeds the whole tool chain. The lexicon decides which words a script may use, and therefore which words a model may generate. The shape becomes the compiler’s error message, word for word. The labels become the English sentences in which a script is read back. The concerns attached to each term decide which audience sees it on a diagram. And because Gnomon’s classes are declared as subclasses of the borrowed ones (a gn:Dataset is also a dcat:Dataset and a prov:Entity), the compiled graph is readable by tools that have never heard of Gnomon.
Info
The grammar of gnomocode is generated from the kernel alone. Words come from the lexicon, so adding a module adds vocabulary without changing the grammar. Extending the language is a matter of editing data, not releasing code.
The language
Why not let the model write RDF directly and validate it with SHACL? RDF is precise, but it is not something I want to read in a review. Here is the invoice agent as gnomocode, 23 lines:
fix-invoices.gnc
---
gnomon: 0.2.2
as_of: 2026-10
state: TARGET
import: systems, deployment, ml, agent, process
---

finance_team: Team
erp: Application
    owned_by = finance_team
    runs_on = CloudEnvironment() ~0.5        # "in the cloud, I think"
invoices: Dataset
    stored_in = erp
    contains_personal_data = true

invoice_agent: AIAgent
    uses = LanguageModel()
    classifies(invoices, frequency = 200/DAY)

fixing: Process = check >> ("amount > 10k" => review | post)
review.performer = finance_team
invoices -> check -> checked_invoices
checked_invoices: Dataset
It compiles to 76 lines of RDF. Three forms carry almost everything: name: Type declares an element, property = value states a fact about it, and action(object) says what it does. Flows connect steps (>>) and data (->). The notation borrows from places people already know: front matter from Markdown, indented blocks and assignments from Python, arrows from graph query languages. Even the case of a word tells you its kind: Type, property, CONSTANT.
The front matter pins the release of the ontology the script was written against, says whether it describes the current state or a target, and imports only the modules the text needs. An old script therefore compiles against the same release, or gets migrated to a new one on purpose.
Look at the ~0.5 on the runs_on line. It means “I think so, but I am only half sure”, and it is part of the language. Confidence has a few reference points: 1 is confirmed in a system or a document, 0.8 is stated by someone who does the work, 0.5 is second-hand, 0.2 is a guess. Below 0.7 a fact is not an error, but it is reported as a finding. In the graph it becomes an annotated statement, so you can query for everything that still needs confirming:
fix-invoices.trig (excerpt)
    rdf:subject :erp ;
    rdf:predicate gn:runsOn ;
    rdf:object minted:cloud-environment-0 ;
    gn:confidence 0.5 .
The syntax at a glance
The invoice script uses only part of the language. Here is most of the rest in one script that compiles, with a comment on what each line does:
support.gnc
---
gnomon: 0.2.2
as_of: 2026-10
state: CURRENT
import: systems, deployment, ml, agent, process
---

sales_team: Team                             # declares an element
support_team: Team
cloud_account: CloudEnvironment
tickets: Dataset
product_catalogue: Dataset

crm: Application
    runs_on = cloud_account ~0.8             # a fact and its confidence
    owned_by = sales_team                    # inverse reading of owns
    search_tool: Tool                        # a part of crm

support_agent: AIAgent
    uses = search_tool, LanguageModel()      # two values, one unnamed
    reads(product_catalogue)                 # an action: a new activity
    summarises(tickets, frequency = 50/DAY)  # with its own properties

LanguageModel[0] is gpt_4o                   # two names, one element
gpt_4o: LanguageModel
    name = "GPT-4o"

triage: Process = sort >> ("urgent" => call_back | answer)
sort: Classification
    performer = support_agent
    duration = 3 MIN                         # a quantity with a unit
call_back.performer = support_team
tickets -> sort -> sorted_tickets            # data flows through a step
sorted_tickets: Dataset
A few things are worth noticing. A declaration inside a block makes the element a part of its parent, so nesting is how you say “consists of”. An action such as reads(product_catalogue) does not need a name: the compiler creates an unnamed activity of the right kind, with the agent as its performer and the catalogue as its input, and numbers it so that later lines can refer to it. And | in a flow means exactly one branch is taken, while & means all of them are.
A compiler in Python, built on Lark
The compiler is plain Python 3.14, managed with uv. Parsing is done by Lark [20], a parsing toolkit for Python under the MIT licence. The grammar is not written by hand: gnomon grammar generates it from the kernel of the ontology, with one slot per class of words. A new module adds words, never grammar rules. An excerpt:
gnomocode.lark (excerpt)
declaration: NAME ":" type_ref confidence? assigned_flow? _NEWLINE block?
block: _INDENT member+ _DEDENT
own_property: NAME "=" values _NEWLINE
own_action: NAME "(" [arguments] ")" confidence? _NEWLINE
step_flow: step_term (">>" step_term)+
data_flow: reference ("->" reference)+
group: "(" branch ("|" branch)* ")" -> one_of
     | "(" branch ("&" branch)+ ")" -> all_of
confidence: "~" NUMBER

TYPE: /[A-Z][A-Z0-9]*[a-z][A-Za-z0-9]*/
CONST: /[A-Z][A-Z0-9_]*(?![A-Za-z0-9_])/
NAME: /[^\W\dA-Z]\w*/
Indentation works exactly as in Python, because Lark ships a post-lexer for it. Subclass Indenter, name the tokens, and the LALR parser receives _INDENT and _DEDENT like any other token:
syntax.py (abridged)
from lark import Lark
from lark.indenter import Indenter


class GnomocodeIndenter(Indenter):
    NL_type = "_NEWLINE"
    OPEN_PAREN_types = ["LPAR", "LSQB"]
    CLOSE_PAREN_types = ["RPAR", "RSQB"]
    INDENT_type = "_INDENT"
    DEDENT_type = "_DEDENT"
    tab_len = 4


parser = Lark(
    grammar,
    parser="lalr",
    postlex=GnomocodeIndenter(),
    propagate_positions=True,
)
LALR keeps parsing fast and deterministic, which matters when the studio rechecks the script after every pause in typing. propagate_positions keeps the line and column of every node, so each diagnostic can point at the exact span of the source. A Lark Transformer turns the parse tree into statements; rdflib [21] builds the graph from them; the rules of the release derive further facts; and pySHACL [22] validates the result against the shapes of the ontology. Every violation is mapped back to the line it came from.
What the compiler says
Mistype a word and the compiler answers like a linter, with the line, a caret and a suggestion taken from the lexicon:
typos.gnc
---
gnomon: 0.2.2
as_of: 2026-10
state: TARGET
import: systems, ml, agent
---

finance_team: Team
erp: Application
invoices: Dataset
    stored_at = erp
reviewer: HumanRol
gnomon check typos.gnc
typos.gnc:11:5: error type/vocabulary: unknown property `stored_at`
   |
11 |     stored_at = erp
   |     ^^^^^^^^^
   = hint: did you mean `stored_in` or `stores`?
typos.gnc:12:11: error type/vocabulary: unknown type `HumanRol`
   |
12 | reviewer: HumanRol
   |           ^^^^^^^^
   = hint: did you mean `HumanRole` or `HumanReview`?
typos.gnc: blocked (2 errors, 0 warnings, 0 infos)
Syntax errors look the same. Indent a block by three spaces instead of four and you get:
gnomon check
syntax.gnc:9:1: error syntax/indentation: an indentation of 3 spaces
  |
9 |    owned_by = finance_team
  | ^^^
  = hint: indent with four spaces per level
A script that compiles still gets its findings. For support.gnc above the verdict is compiles (0 errors, 12 warnings, 18 infos), starting with lines such as:
gnomon check support.gnc
support.gnc:11:1: warning finding/missing-owner: no owner: `tickets`
support.gnc:11:1: warning finding/missing-personal-data-marker: personal data not marked: `tickets`
support.gnc:19:1: warning finding/missing-owner: no owner: `support_agent`
support.gnc:28:52: warning finding/missing-performer: no performer: `answer`
support.gnc:19:1: info finding/missing-runs-on: where it runs is not stated: `support_agent`
support.gnc: compiles (0 errors, 12 warnings, 18 infos)
With --format json the same diagnostics come as records. This is what the translator receives in the repair loop:
gnomon check --format json typos.gnc (first record)
{
  "file": "typos.gnc",
  "line": 11,
  "column": 5,
  "end_line": 11,
  "end_column": 14,
  "severity": "error",
  "code": "type/vocabulary",
  "message": "unknown property `stored_at`",
  "hint": "did you mean `stored_in` or `stores`?",
  "rules": []
}
From a sentence to a line to a picture
Each line of the script answers something somebody said. Suppose the kick-off meeting went on a few minutes longer. This is how its sentences map onto the script, and how the compiler reads each line back, in its own controlled English (gnomon explain, no model involved):
| What was said | Gnomocode | What the compiler reads back |
|---|---|---|
| ”We are building…” | state: TARGET | This description is of the target state, as of 2026-10. |
| ”…an agent…” | invoice_agent: AIAgent | Invoice agent is an AI agent. |
| ”…that uses an LLM…” | uses = LanguageModel() | Invoice agent uses the unnamed language model 0. |
| ”About 200 invoices a day.” | classifies(invoices, frequency = 200/DAY) | Invoice agent classifies invoices (classification 0). The frequency of the unnamed classification 0 is 200 per day. |
| ”Invoices hold customer data.” | contains_personal_data = true | Invoices contains personal data. |
| ”The ERP is in the cloud, I think.” | runs_on = CloudEnvironment() ~0.5 | Possibly (confidence 0.5): erp runs on the unnamed cloud environment 0. |
| ”Anything over 10k goes to review.” | check >> ("amount > 10k" => review | post) | After check comes exactly one of these: review when “amount > 10k”; post. |
| ”Finance does the review.” | review.performer = finance_team | The performer of review is finance team. |
The read-back matters more than it looks. A person who will never learn gnomocode can still check, sentence by sentence, whether the script says what they meant. And a language model that turns the script into prose works from these sentences, so it has nothing to guess.
The same lines are also a picture. The process line becomes the process view, with the branch, its condition and the performer of the review:

Vague is valid, contradictions are not
This is the principle I am most attached to. A real conversation is full of gaps and guesses. A language that rejects every incomplete statement will never be used; a language that accepts everything is useless. So the compiler draws a different line: it accepts vagueness and rejects contradictions.
invoice_agent: AIAgent is valid. It is vague, but it is true. The statements below are not, and the compiler says why, with the line and the reason taken straight from the ontology:
invalid.gnc
---
gnomon: 0.2.2
as_of: 2026-10
state: CURRENT
import: systems, deployment, process
---

finance_team: Team
erp: Application
invoices: Dataset
    runs_on = erp
check: Activity
    automation_level = MANUAL
    automation_level = AUTOMATED
erp: Dataset
module_a: System
    part_of = module_b
module_b: System
    part_of = module_a
gnomon check invalid.gnc
invalid.gnc:9:1: error inconsistency/disjoint-kinds: disjoint kinds: `erp`
invalid.gnc:11:15: error type/signature: only a system, a model or an activity can run on something: `invoices`
invalid.gnc:14:24: error inconsistency/single-value: two values of a single-valued term: `check`
invalid.gnc:17:15: error inconsistency/cycle: partOf cycle: `module_a`
invalid.gnc:19:15: error inconsistency/cycle: partOf cycle: `module_b`
invalid.gnc: blocked (5 errors, 8 warnings, 5 infos)
The compiler talks back
Diagnostics have three levels. Errors block; warnings and infos pass. The useful side effect is that the missing information turns into questions. The invoice script compiles, with 11 warnings and 15 infos, and those read like the agenda for the next meeting:
| The compiler says | The question it is asking |
|---|---|
no owner: invoices | Who owns the invoices? |
no tool: invoice_agent | What can the agent actually do? |
where it runs is not stated: invoice_agent | Where is it hosted? |
personal data not marked: checked_invoices | Does the output fall under GDPR too? |
a fact below the confidence threshold: erp runs on | Is the ERP really in the cloud? |
These are the questions nobody asked at the kick-off. The same messages, with their line numbers and hints, are what the translator receives in the repair loop. In practice that is what makes a language model usable here: it gets an error it can act on, not a shrug.
One model, many pictures
A diagram is a projection of the graph, not the model itself. Gnomon draws three views of a script (architecture, process and data lineage), filters them for an audience (executives, architects, legal and compliance, security, operations) and folds them to a level of detail. A lawyer sees the personal data and where it is kept; an architect sees every part.
The drawing itself is replaceable too. The same compiled graph goes to Gnomon’s own isometric canvas, to Mermaid, or to LikeC4, and nothing in the script changes:

Each renderer makes its own choices. The canvas sets the ERP on the slab of the cloud it runs on and marks personal data with a red lock. Mermaid labels every edge. LikeC4 stacks the same edges top-down. The facts underneath are identical, which is the point: you can argue about the picture without arguing about the system.
From the same graph, the rules of the ontology also recommend where an agent could take over work, ranked by effort, with the facts still missing to decide.
Evaluation
I did not want to show only a demo, so I built a way to measure the translation.

There are three measures. Coverage says how much of the original the prose still says. Faithfulness says how much of the prose the original supports. Graph F1 counts the facts two graphs share, and it is computed by code, with no model involved. The first two use a language model as a judge [13]: it extracts claims from a text, each with a quote of the original that code then verifies, and gives a verdict per claim.
The test set is 54 texts about architectures, agent systems, data pipelines, processes and audits, all from public sources that allow reuse: 40 from the Azure Architecture Center [18], 5 from the GDS Way [17] and 9 algorithmic transparency records of the UK government [19]. Each has a golden script written for it.
Does it compile?
With Claude Sonnet 5.5 as the translator, all 54 texts ended up as scripts that compile. 29 compiled at once, 23 needed one repair round, and 2 needed two or three.

Where do the facts go?
Of 100 claims in an original text, 58 survive the round trip. The interesting part is where the other 42 go. Splitting the loss into layers shows that about 40 are lost because the language, and my golden scripts, cannot say them yet. The translator loses only 7.

I find this the most useful result of the whole project. The bottleneck is the language, not the translator. That is a very different to-do list from “use a bigger model”, and it tells me which words to add next.
How far to trust the judge, and the graph?
Not blindly. The judge finds every claim of a text in the text itself, and 99.7 of 100 in a text with a fifth of its sentences removed. But when asked to notice the removed claims, it caught only 57 of 100. Two different judges (gpt-oss-120b and Claude Haiku 4.5) gave the same verdict on 73% of 6,054 claims, a Cohen’s kappa of 0.55, which counts as moderate [14].
The graph measure needs no judge. Against its own golden graph, a generated graph scores an F1 of 0.56 on average; against the golden graph of a different text, 0.29.

So the graph is clearly about the right text, and only about half of its facts match. Part of that is the translator choosing different relations and levels of detail for the same fact: two translations of one text agree with each other at an F1 of 0.74. This is enough for a demo, not yet proof, and I would rather say so here than have you find out.
What it looks like
All of this sits behind a local web page, Gnomon Studio: the chat on the left, the script in the middle with live diagnostics and its description in plain English, and the diagram on the right. You describe a system, a script appears, compiles or repairs itself, and the picture updates. Every later message extends the script instead of starting again.

Conclusions
- Everyone sees a different system. This is a people problem before it is a technology problem.
- A shared language beats a better drawing. A drawing can be nicer; only a language can be checked, diffed and versioned.
- The ontology carries the weight. Vocabulary, rules, error messages, read-back and views all come from one place. Borrowing it from existing standards made it smaller and more trustworthy than anything I would have invented.
- Let the model talk, let the compiler decide. Models are excellent at turning messy words into structure and poor at being consistent. Put the determinism somewhere else.
- Measure the layers separately. “58%” alone would have told me to improve the model. Splitting the loss showed me where the loss really was.
- Allow “I don’t know” in the language itself. It changes what people are willing to write down.
What is next: separating the public repository (the ontology, the compiler and the studio); conventions that narrow the ways of writing one fact, since the same text still gives different scripts; words for the 40% the language cannot say yet; and the backward direction at scale, from existing code and diagrams to text.
If you work on architecture descriptions, agent systems, or on making language models and rules cooperate, I would be glad to hear from you. Gnomon is also meant as a working tool for audits: mapping the processes and data of a company before anyone builds an agent for them. The project page collects the scenarios I have translated so far.
References
- W3C, RDF 1.1 Concepts and Abstract Syntax, Recommendation, 25 February 2014.
- W3C, PROV-O: The PROV Ontology, Recommendation, 30 April 2013.
- W3C, SKOS Simple Knowledge Organization System Reference, Recommendation, 18 August 2009.
- W3C, Data Catalog Vocabulary (DCAT), Version 3, Recommendation, 22 August 2024.
- W3C, Shapes Constraint Language (SHACL), Recommendation, 20 July 2017.
- W3C, OWL 2 Web Ontology Language Document Overview (Second Edition), Recommendation, 11 December 2012.
- Data Privacy Vocabularies and Controls Community Group, Data Privacy Vocabulary (DPV), W3C Community Group report.
- QUDT, Quantities, Units, Dimensions and Types.
- Schema.org.
- S. Brown, The C4 model.
- Object Management Group, Systems Modeling Language (SysML) 2.0, 2025.
- Pydantic documentation.
- L. Zheng et al., Judging LLM-as-a-Judge with MT-Bench and Chatbot Arena, NeurIPS 2023 Datasets and Benchmarks Track.
- J. R. Landis, G. G. Koch, The Measurement of Observer Agreement for Categorical Data, Biometrics 33(1), 1977, pp. 159–174.
- Model Context Protocol.
- Agent2Agent (A2A) Protocol.
- Government Digital Service, How GDS provides user support, The GDS Way, Open Government Licence v3.0.
- Microsoft, Azure Architecture Center, CC BY 4.0.
- GOV.UK, Algorithmic transparency records, Open Government Licence v3.0.
- Lark, a parsing toolkit for Python, MIT licence; documentation.
- rdflib, a Python library for working with RDF.
- pySHACL, a SHACL validator in Python.
October 21, 2026
Jaime Buelta
Jev webinar video
I hosted a webinar on the 20th talking about the Jev model, which is a new AI decision model that works well in responding quickly to simple questions to a particular piece of information. This model has been talked about quite a lot recently when it was introduced, as it helps in a lot of workflows where it can be an alternative that’s faster and cheaper than LLMs. It has also spurred a lot of competing decision models, including of course Open Weights alternatives. You can see the recording of the webinar... Read More
Python Engineering at Microsoft
Pylance + Pyrefly: bring your preferred type checker to Visual Studio Code
At Microsoft, our focus is on providing the best possible experience for Python developers – both for everyday coding and for the agentic workflows that are increasingly central to how developers build software. A great type checking experience is a core part of that, not only for surfacing accurate and actionable diagnostics and providing a strong foundation for Intellisense, but as the bedrock of static semantic intelligence for software agents. Today we’re announcing the Type Server Protocol (TSP) and our partnership with Meta to bring Pyrefly support to Pylance.
Introducing the Type Server Protocol
TSP is an open standard that extends LSP – the Language Server Protocol that underpins editor integrations across the industry – designed to allow any editor or tool to integrate type checkers as first-class backends.
Until now, Pylance and Pyright were tightly coupled. TSP creates a clean separation between the two: Pylance becomes the VS Code IDE intelligence layer for Python, and the type checker becomes an interchangeable static analysis component underneath it. Pyright remains the default and continues to power the experience for the vast majority of users. But for developers who have a strong preference – or whose codebase is better served by a different checker – switching is now a straightforward operation, right from the VS Code status bar.
What stays constant regardless of which checker you use is Pylance’s completions, Quick Info, environment management, and critically its deep integration with GitHub Copilot. Those experiences are built on Pylance, not on any individual type checker. TSP means you can bring the checker you want without giving up any of those features that you know and love.
Partnering with Meta to bring Pyrefly to Pylance
We are excited to announce that we have partnered with Meta to design and implement the TSP protocol and make sure that Pyrefly fully supports it. This collaboration is built on a shared belief that the Python ecosystem is better served by interoperability than by fragmentation. Meta brings deep expertise in fast static type analysis and a particular strength in AI/ML library support. Microsoft brings the VS Code IDE integration layer and the GitHub Copilot experience. TSP is the protocol that makes them work together.
Meta has been at the forefront of Python typing longer than almost anyone. Since 2017, they have been solving type checking at scale on some of the world’s largest Python codebases, including Instagram. That experience shaped every design decision in Pyrefly, which checks code at 1.8 million lines per second and was built from the ground up to deliver a consistent experience in both CI and the IDE. Meta has also invested heavily in the broader ecosystem, bringing NumPy to nearly 90% type completeness, completing pandas‘ public API type coverage, and publishing the most comprehensive public performance benchmarks for Python type checkers.
We are proud to partner with Meta on bringing Pyrefly to Pylance and we look forward to the ecosystem growing around this open standard, and to bringing even more choice to Python developers in the future.
Why Pylance + TSP + Pyrefly instead of Pyrefly standalone?
This is the right question to ask. Pyrefly already has a highly performant VS Code extension and is an excellent choice for type checking in continuous integration (CI). Why use it through Pylance instead of directly?
Pylance provides tight integrations with the GitHub Copilot experience that a standalone type checker extension can’t replicate – context provision for AI completions, intelligent code understanding that feeds into GitHub Copilot Chat, MCP tools for Python codebases, and the full suite of Python developer tooling that Pylance has built over years in production. In decoupling Pyright from Pylance we now have a clear separation of concerns where pylance can provide an intelligence layer for Python developers and delegate the heavy lifting of type checking. By using Pyrefly with Pylance via TSP, you get Pyrefly’s type analysis powering the engine, with Pylance’s AI-aware intelligence layer on top. You don’t have to choose.
How to try it
TSP support with Pyrefly requires a Pylance version of 2026.4.1 or newer. Here’s how the experience works.
Automatic detection
When you open a workspace, Pylance checks your Python environments for a Pyrefly installation.
If it finds one – whether installed in your virtual environment or signaled by a pyrefly.toml or tool.pyrefly config in your pyproject.toml – you’ll see a notification:
Pyrefly was found in your Python environment. Would you like to use it as your source of diagnostics in VS Code?
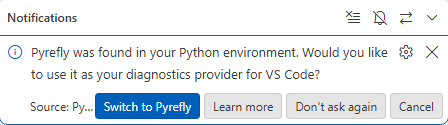
Click Switch to Pyrefly and Pylance will activate Pyrefly as your diagnostics source immediately, registering the path to the Pyrefly executable automatically. No manual configuration needed. and the choice to “Switch to Pyrefly” can always be reverted or reenabled via Settings.
Manual setup via settings
You can also switch at any time through the VS Code Settings UI. Under Python › Analysis: Diagnostics Source, you’ll find a dropdown with three options:
- Pylance – default, uses Pylance’s built-in analysis
- Pylance + Pyright – explicitly routes diagnostics through Pyright
- Pylance + Pyrefly – uses Pyrefly as the diagnostics engine
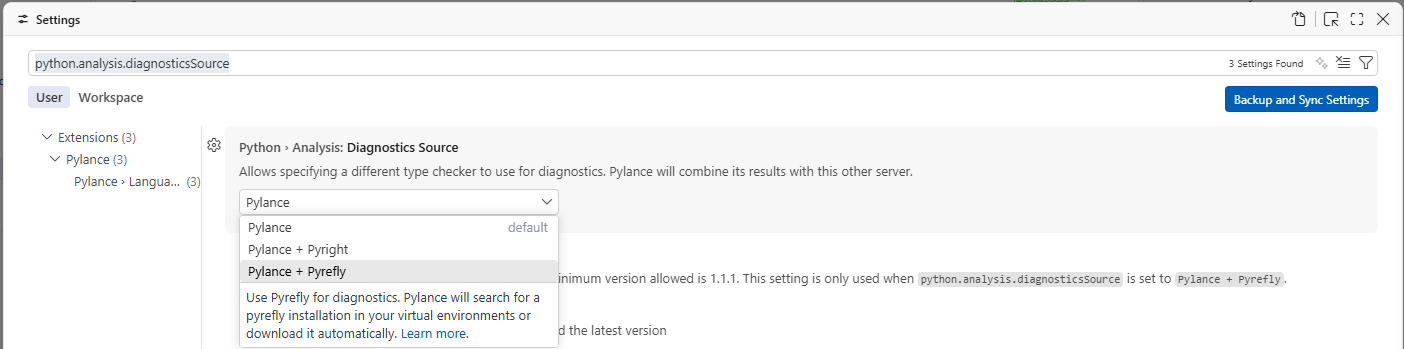
When Pylance + Pyrefly is selected, Pylance will search for a Pyrefly installation in your virtual environments or download it automatically.
A companion Python › Analysis: Pyrefly Version setting lets you pin a specific version, point to a local executable, or leave it empty to always use the latest. The minimum supported version is 0.60.0.
Status bar
Once active, the status bar shows Diagnostics Source: Pylance + Pyrefly alongside your interpreter and environment.
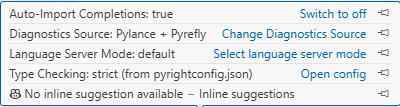
Clicking it opens the Python › Analysis: Diagnostics Source setting.
What do you think?
Try the new Pylance + Pyrefly experience today in VS Code and let us know your thoughts. Share any feedback by opening an issue or voting on an existing one. You can also leave a comment below or reach us on X.
The Pyrefly team have their own blog post on TSP and the work we have done together.
The post Pylance + Pyrefly: bring your preferred type checker to Visual Studio Code appeared first on Microsoft for Python Developers Blog.
Rodrigo Girão Serrão
Tachyon: sampling profiling in Python
Learn how to use Tachyon, Python's sampling profiler.
“Tachyon” is a new sampling profiler that was introduced in Python 3.15. It provides a CLI that allows running and profiling scripts or attaching to running processes.
 Tachyon logo
In this article you'll learn what statistical profiling is and how to use the Tachyon CLI to identify performance bottlenecks in your code.
15 days of Python 3.15
To celebrate the release of Python 3.15, over the next 15 business days I'll be writing about a new 3.15 feature every day. Explained clearly and with examples so you don't have to sift through the changelog.
Subscribe to receive this free email series:
If you want, you can also check the schedule of the upcoming emails.
What is statistical profiling
Statistical profiling is the practice of profiling your code by periodically taking snapshots of the state of your Python program. Since you're periodically snapshotting the call stack of your program, you call Tachyon a sampling profiler.
Tachyon collects all of its samples over a profiling run and uses it to estimate how much time is being spent in each part of your code.
Suppose Tachyon collects 1,000,000 samples over the course of 10 seconds.
Out of those 1,000,000 samples, assume 25,000 samples (2.5%) show the function foobar.
Tachyon estimates that you spent 2.5% of the 10 seconds, or 250 miliseconds, inside the function foobar.
The longer Tachyon runs, and the higher its frequency (the shorter the interval between snapshots), the more accurate the results that Tachyon produces.
Using the Tachyon CLI
Tachyon is the “cool” name for the module profiling.sampling from the standard library.
Since it's a module...
Mariatta
Python Core Sprint 2026: Day 2
Day 2 of the Python Core Sprint was all about one thing for me: moving our GitHub bots, bedevere, blurb_it, and miss-islington, off Heroku and onto the PSF’s Cabotage. Monday was prep. Yesterday was the switch.
The facts first. The downtime was announced for 11 AM to 12 noon Pacific. Here is how it went, in Pacific time:
- 11:00 AM: posted on Discord that the downtime was starting.
- 11:35 AM: bedevere switched over to Cabotage.
- 12:08 PM: miss-islington switched over.
- 12:17 PM: first backport created on Cabotage.
- 12:36 PM: updated the Discourse thread to say “This is now completed.”
Zachary Ware commented that it sounded like it went very smoothly.
Python Insider
Python 3.15.1, 3.14.9 and 3.13.17 are out
Three certified security releases for 3.15, 3.14 and 3.13.
October 20, 2026
PyCoder’s Weekly
Issue #757: Django Migrations, Functional Programming, MVC, and More (2026-10-20)
#757 – OCTOBER 20, 2026
View in Browser »

Django ORM, Migrations and makemigrations
This tutorial builds a small coffee and tea store one migration at a time, then breaks it on purpose. You’ll backfill a required field, roll a migration back, untangle two developers’ migrations and fix a slow page with Django 6.1’s new fetch modes.
MY-SPACE.IO • Shared by Mirza Ishraq Yeahia
Functional Programming in Python: When and How to Use It
See how Python supports functional programming, what the paradigm actually is, and where it fits in the code you write day to day.
REAL PYTHON
MCP Auth That Passes the Security Review

When your customers connect AI agents to your product, their security team will have questions. PropelAuth has the answers built in: role-gated scopes, enterprise SSO through Okta and Entra ID, phishing-resistant consent screens, and an audit log of every agent connection. Learn More →
PROPELAUTH sponsor
Exploring the MVC Pattern in Python
Learn how the Model-View-Controller pattern organizes Python web apps, then build a small Flask app using models, views, and controllers.
REAL PYTHON course
Claude Code Course: Stop Copy-Pasting From ChatGPT
Build a complete Python CLI app from an empty directory with Claude Code, in two live 4-hour sessions on October 24–25. You’ll plan features, run tests, manage git, and debug AI-generated code.
REAL PYTHON
Articles & Tutorials
PyTorch Year in Review: OpenTeams’ Contributions in 2026
OpenTeams’ PyTorch team reviews their 2026 contributions, in a year when PyTorch received 58% more pull requests than the same period of 2025, a growing share of them written with AI coding agents. Highlights include a redesign of the symbolic interpreter in torch.compile, day 1 compiler support for Python 3.15, a new operator, and a build backend re-write!
ANDREW JAMES • Shared by Andrew James
Bayesian Optimization for Efficient Hyperparameter Search
Instead of testing every hyperparameter combination, Bayesian optimization uses results from earlier trials to decide what to try next. This hands-on tutorial builds it step by step with scikit-learn’s GaussianProcessRegressor and a custom Expected Improvement function, plotting the model’s predictions and uncertainty along with each point the search picks.
KHUYEN TRAN • Shared by Khuyen Tran
Pendulum and the Most Cursed + Operator in All of Python
Pendulum, a popular Python datetime library, has a + operator that inspects the call stack to decide which answer to give you. The post explains how it ended up there, and why the design behind it, a “drop-in” subclass of datetime, still matters for your code now that the hack itself has been patched.
ARIE BOVENBERG • Shared by Arie Bovenberg
Checking Email Reputation, and Allowing Outlook Again
Two years ago, PyPI prohibited Outlook email domains in the registration of new accounts due to a large malware campaign. With an update to how email reputation is calculated, addresses from outlook.com and hotmail.com can once more be used.
MIKE FIEDLER
Why Parquet Dominates Modern Data Engineering
How Parquet’s columnar layout, encodings, zstd compression, and row group statistics make it smaller and faster to read than CSV, measured on NYC taxi trips data with Polars, DuckDB, and PyArrow.
ORAL ERSOY DOKUMACI • Shared by Oral Ersoy Dokumaci
Gemini 4 Argon Draws a Python Reading a Book
Explore Gemini 4 Argon’s Python code, turtle drawing, and responses to small tasks that check modern syntax, release knowledge, focused edits, and made-up functions.
REAL PYTHON
Python Project Structure: How to Choose the Right Layout
Learn how to structure Python projects: pick between flat and src/ layouts, organize your code, and apply the patterns to CLI, web, and GUI apps.
REAL PYTHON
Docling vs LlamaParse: How to Extract PDF Tables in Python
Learn how to extract tables from a PDF in Python with Docling and LlamaParse, and compare local parsing against a cloud API on speed and cost.
REAL PYTHON
Strings and Character Data in Python
Work with Python strings using a rich set of operators and functions: string literals, the str() function, and the methods you’ll use most.
REAL PYTHON
How to Use Python: Taking Your First Steps
Take your first steps with Python. Install it, run your first program, and work with variables, data types, loops, functions, and errors.
REAL PYTHON course
11 Beginner Tips for Learning Python Programming
Python tips for beginners: the learning strategies and habits that take you from your first script to code you’re proud of.
REAL PYTHON
Projects & Code
Events
Weekly Real Python Office Hours Q&A (Virtual)
October 21, 2026
REALPYTHON.COM
Swiss Python Summit 2026
October 22 to October 24, 2026
PYTHON-SUMMIT.CH
PyCon Panamá 2026
October 22 to October 24, 2026
PYCON.PA
Django Girls Ho 2026
October 22 to October 24, 2026
DJANGOGIRLS.ORG
PyHo 2026
October 23 to October 25, 2026
PYTHONHO.COM
PyBeach 2026
October 24 to October 25, 2026
PYBEACH.ORG
FastAPI Conf 2026
October 28 to October 29, 2026
FASTAPICONF.COM
PyConFR 2026
October 29 to November 2, 2026
PYCON.FR
Happy Pythoning!
This was PyCoder’s Weekly Issue #757.
View in Browser »
[ Subscribe to 🐍 PyCoder’s Weekly 💌 – Get the best Python news, articles, and tutorials delivered to your inbox once a week >> Click here to learn more ]
Python Bytes
#501 A Nod to Sir-Mix-Alot
<strong>Topics covered in this episode:</strong><br> <ul> <li><strong><a href="https://blog.jupyter.org/posts/2026/notebooks-on-demand-nod-a-jupyterlab-extension-for-a/?featured_on=pythonbytes">Nod: pause your Python program and open a notebook at any line</a></strong></li> <li><strong><a href="https://pola.rs/posts/release-polars-2/?featured_on=pythonbytes">Polars 2.0 ships: streaming engine by default, spill-to-disk, and a row-order gotcha</a></strong></li> <li><strong><a href="https://github.com/noripyt/django-cachalot?featured_on=pythonbytes">django-cachalot caches your ORM queries and invalidates them for you</a></strong></li> <li><strong><a href="https://noumenal.es/stack-report/towards-async-transactions-in-django/?featured_on=pythonbytes">Towards async transactions in Django</a></strong></li> <li><strong>Extras</strong></li> <li><strong>Joke</strong></li> </ul><a href='https://www.youtube.com/watch?v=TGDze5W1EZ8' style='font-weight: bold;' data-umami-event="Livestream-Past" data-umami-event-episode="501">Watch on YouTube</a><br> <p><strong>About the show</strong></p> <p>Sponsored by us! Support our work through:</p> <ul> <li>Our <a href="https://training.talkpython.fm/?featured_on=pythonbytes"><strong>courses at Talk Python</strong></a></li> <li>Consulting from <a href="https://sixfeetup.com/?featured_on=pythonbytes"><strong>Six Feet Up</strong></a> <strong>Connect with the hosts</strong></li> <li>Michael: <a href="https://fosstodon.org/@mkennedy">Mastodon</a> / <a href="https://bsky.app/profile/mkennedy.codes?featured_on=pythonbytes">BlueSky</a> / <a href="https://x.com/mkennedy?featured_on=pythonbytes">X</a> / <a href="https://www.linkedin.com/in/mkennedy/?featured_on=pythonbytes">LinkedIn</a></li> <li>Calvin: <a href="https://sixfeetup.social/@calvin?featured_on=pythonbytes">Mastodon</a> / <a href="https://bsky.app/profile/calvinhp.com?featured_on=pythonbytes">BlueSky</a> / <a href="https://x.com/calvinhp?featured_on=pythonbytes">X</a> / <a href="https://www.linkedin.com/in/calvinhp/?featured_on=pythonbytes">LinkedIn</a></li> <li>Show: <a href="https://fosstodon.org/@pythonbytes">Mastodon</a> / <a href="https://bsky.app/profile/pythonbytes.fm">BlueSky</a> / <a href="https://x.com/PythonBytes?featured_on=pythonbytes">X</a></li> <li>Join us on YouTube at <a href="https://pythonbytes.fm/stream/live"><strong>pythonbytes.fm/live</strong></a> to be part of the audience. Usually <strong>Tuesday at 7am PT</strong>. Older video versions available there too.</li> <li>Finally, if you want an artisanal, hand-crafted digest of every week of the show notes in email form? Add your name and email to <a href="https://pythonbytes.fm/friends-of-the-show">our friends of the show list</a>, we'll never share it.</li> </ul> <p><strong>Michael #1:</strong> <a href="https://blog.jupyter.org/posts/2026/notebooks-on-demand-nod-a-jupyterlab-extension-for-a/?featured_on=pythonbytes">Nod: pause your Python program and open a notebook at any line</a></p> <p>Nod (Notebooks-on-Demand) is a JupyterLab extension by Eric Rawn that drops a notebook into a running Python program. Add a <code>notebook()</code> call anywhere, run the program with <code>nod</code>, and execution pauses there with a notebook containing all variables at that point in the call stack. Edits go back to the source file with a button, with cells converted to code and markdown to comments via Jupytext.</p> <ul> <li>It answers the classic 'this would be easier in a notebook' debugging moment without copying snippets out to files.</li> <li>Like a breakpoint with a notebook inside: the left panel walks the call stack and notebook state switches with it</li> <li>Install is pip install nodpy plus nod --install-kernel, then run with nod python -m myfile</li> <li>The round trip back to source is the differentiator; markdown cells become comments, cells become newlines, and notebooks are disposable since the source file recreates them</li> <li>nodLog() stashes variable values across calls to explore later; the article also pitches notebook() for stepping through AI-generated code line by line</li> <li>Early stage: repo from December 2025 with 16 stars and essentially one contributor, so expect rough edges</li> </ul> <p><strong>Calvin #2: <a href="https://pola.rs/posts/release-polars-2/?featured_on=pythonbytes">Polars 2.0 ships: streaming engine by default, spill-to-disk, and a row-order gotcha</a></strong></p> <ul> <li>Polars 2.0 released Oct 6, 2026 (Ritchie Vink). The post says it's "not intended to be a big feature release", but it bundles a few big changes.</li> <li>LazyFrame.collect now defaults to the streaming engine, with large memory and speed gains on most queries.</li> <li>Breaking: streaming doesn't guarantee row order for join, group_by and unpivot. Use maintain_order=True if order matters. This is why it's a major version.</li> <li>Out-of-core (spill-to-disk) is on by default. It spills at about 80% of RAM ("may need tuning") with a 64 GB default disk budget. It covers sort, window functions and many expressions. Joins and group-bys are planned, not shipped.</li> <li>The new native Map dtype (Arrow MapType) replaces the old List(Struct(key, value)) reading. It comes with map.get, map.contains_key, map.len, map.keys and map.values.</li> <li>Stricter by design: errors should surface up front and implicit handling of data mismatches is opt-in. collect_schema() catches schema mismatches without reading data.</li> <li>SQL is now a first-class interface, with join reordering, better common-subplan elimination, and dynamic predicates/bloom filters.</li> <li>Benchmarks are self-run TPC-H/TPC-DS derived numbers against DuckDB 1.5.6 and 2.0 alpha, and DataFusion 54. They are not official TPC results.</li> <li>Polars was fastest on all but one benchmark. At 192 threads its constant overhead hurts small data (SF10 TPC-DS is 1.8x slower), and a fix is hoped for in the next release.</li> <li>Roadmap, not released: out-of-core joins and group-bys, better scaling at high core counts, Polars Cloud, and early GeoPolars work.</li> <li>Upgrade guide: https://docs.pola.rs/releases/upgrade/2/</li> </ul> <p><strong>Michael #3:</strong> <a href="https://github.com/noripyt/django-cachalot?featured_on=pythonbytes">django-cachalot caches your ORM queries and invalidates them for you</a></p> <p>django-cachalot is a Django package that caches ORM queries and invalidates them automatically when the underlying data changes. Install it, add one line to INSTALLED_APPS, and read queries run through your cache backend with no code changes. The trick is that it caches whole tables, so any write flushes that table's cached queries, making it a strong fit for read-heavy sites and a poor one for frequently updated tables. It supports Django 4.2 through 6.1 and Python 3.8 to 3.14.</p> <ul> <li>ORM caching that normally takes careful engineering drops in with pip install and one settings line, invalidation included.</li> <li><strong>Near-100x on joins:</strong> the README reports nearly 100x speedups for initial deployments heavy on select_related and prefetch_related.</li> <li>It caches the entire table, so a hot table with frequent writes invalidates constantly; docs suggest staying under 50 modifications per minute and mixing in cache-machine for hot paths.</li> <li>Setup is two lines, plus caveats: sync clocks across servers sharing one cache, and run a <a href="http://manage.py/?featured_on=pythonbytes">manage.py</a> command after restoring a database outside Django.</li> </ul> <p><strong>Calvin #4: <a href="https://noumenal.es/stack-report/towards-async-transactions-in-django/?featured_on=pythonbytes">Towards async transactions in Django</a></strong></p> <ul> <li>Carlton Gibson, The Stack Report, Oct 9, 2026. It's about getting async with transaction.atomic() into Django, hoped for 6.2 and not a commitment. Status check: both PRs are still open as of Oct 19-20, with no approvals and no milestone.</li> <li>The problem: asyncio tasks share one thread and so one DB connection. A slow transaction that rolls back also discards a sibling task's quick write. Today transactions go through sync_to_async, so everything runs serially on one thread.</li> <li>Design: async with transaction.atomic() opens a nested ThreadSensitiveContext, which gets its own worker thread and connection. On exit the connection is cleaned up and control returns to the request's connection. Siblings keep using the request's connection in autocommit, so their writes survive a rollback.</li> <li>Only the task that opened the block may nest further atomic() blocks. Any other task raises TransactionManagementError, and this is enforced.</li> <li>Subtasks inside a transaction are discouraged, since the connection is serial and parallel queries gain little. If you need them, use structured concurrency (TaskGroup or an awaited gather()) so they finish before the block exits. That rule is not enforced yet, and Gibson wants Django to catch late queries before 6.2.</li> <li>Caveats: each async transaction uses an extra connection for its duration, so pools may need tuning. The advice to disable CONN_MAX_AGE for async still applies.</li> <li>Origin: the Django on the Med sprint in Pescara (hosted by Paolo Melchiorre). An expert panel on Day 1 included Lily Acorn, Simon Charette, Jacob Walls, and Charlie Denton and Sam Searles-Bryant of Kraken Tech (authors of django-subatomic, which is being integrated into Django). Caleb Hattingh then investigated the design and opened both PRs.</li> <li>PRs: Django #22074 ("Fixed #33882 -- async with transaction.atomic") has review comments from four people, with the latest commit on Oct 19 adding a test for a late child-task query. asgiref #596 (ThreadSensitiveContext changes) had Gibson's review on Oct 19 and follow-up edits on Oct 20.</li> </ul> <p><strong>Extras</strong></p> <p>Calvin:</p> <ul> <li>Jazzband is Shutting Down (announced in March), but there are alternatives like https://django-commons.org/</li> <li>Treemd — nice TUI for viewing Markdown https://github.com/Epistates/treemd Michael:</li> <li>Talk Python <a href="https://talkpython.fm/community?featured_on=pythonbytes">Membership</a></li> <li>Talk Python <a href="https://talkpython.fm/guides?featured_on=pythonbytes">Visual topic guides</a></li> <li>Quick Follow Up to Episode #499 where we shared PEP 824 None coalescing operator, we also have <a href="https://peps.python.org/pep-0823/?featured_on=pythonbytes">PEP 823</a> (None Aware access operators) the successor to PEP 505. - via Nick Muoh and <a href="https://social.tchncs.de/@rafaelwo/117415996506597741?featured_on=pythonbytes">Rafael</a></li> <li><a href="https://github.com/pola-rs/polars/issues/27955?featured_on=pythonbytes">Free Threaded Polars, but staled on PyPI</a>?</li> </ul> <p><strong>Joke:</strong> <a href="https://www.youtube.com/watch?v=3TNpOD6bov8">LGTM (Looks Good to Me) - Claude Opus 5.5 music video</a></p>
Rodrigo Girão Serrão
DX improvements in Python 3.15
Learn about the top 3 developer experience improvements from Python 3.15
This article covers the top 3 improvements made to the developer experience of Python 3.15 users:
- improved error messages
- more colours
- default UTF-8 encoding
15 days of Python 3.15
To celebrate the release of Python 3.15, over the next 15 business days I'll be writing about a new 3.15 feature every day. Explained clearly and with examples so you don't have to sift through the changelog.
Subscribe to receive this free email series:
If you want, you can also check the schedule of the upcoming emails.
Improved error messages
Over the past few years, lots of effort has been poured into improving Python's error messages. Python 3.15 is no exception, as it introduces three improved types of error messages.
Errors in accessing nested attributes
If you get an AttributeError exception when accessing a name of an object, but that object has another member that has the correct name, Python suggests it:
class Inner:
    def __init__(self):
        self.value = 42

class Outer:
    def __init__(self):
        self.inner = Inner()

o = Outer()
o.value
# AttributeError: 'Outer' object has no attribute 'value'.
# Did you mean '.inner.value' instead of '.value'?
Incidentally, while Python 3.15 was in alpha, I found and reported a bug with this feature that was fixed in just a couple of hours!
Checking methods from popular programming languages
If you get an AttributeError when trying to access a method from a built-in type, Python starts by checking if that's a typo.
For example, list.pp will ask if you meant to type list.pop.
Now, if there's no “obvious” typo, Python will also check a static table of common...
Mariatta
Python Core Sprint 2026: Day 1
This week I’m in San Francisco for the annual Python Core Sprint. This year the sprint is hosted by Brandt Bucher from OpenAI, at OpenAI’s office, and runs Monday to Friday, October 19 to 23. I’m only here for the first three days. On Thursday I fly out to Seattle for SeaGL, where I’m one of the keynote speakers :)
I could not make it to last year’s sprint at Arm in Cambridge, UK, and it is unlikely I’ll be able to make it to next year’s European sprint either, so I’m glad this one is on the West Coast and within reach. The sprint is one of the very few times in a year when this many Python core team members are in the same room, focused on nothing but Python. It is still one of my favorite Python events of the year. Thank you to Brandt and OpenAI for hosting us!